Various and sundry charts of new home sales paint a big picture of the single family home development industry and what it tells us about the current and future state of the US economy. It also tells us that the US single family home building industry is setting up as a good short on a longer term basis.
This chart shows new home sales compared with the number of full time jobs. Sad!
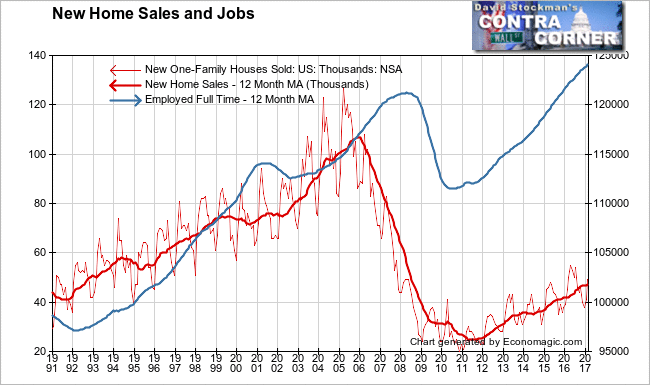
All charts use actual, not seasonally adjusted data.
New home sales and the number of full time jobs correlated well until 2006, when sales topped out. They collapsed in 2007 but jobs kept growing. This illustrates the principle of “Employers are always the last to get the news.”
But jobs finally fell and the housing crash and jobs fell in tandem until 2010. Then jobs turned. New home sales bottomed the following year and but this time they could not match jobs growth. Why? First, because jobs did not crash to the degree new home sales did. Second, new home sales didn’t recover as much as jobs did.
Conclusion: The new jobs didn’t pay people enough to afford new homes. That wasn’t just because the jobs did not pay enough, but also because home prices started inflating at a breakneck pace. They continue to inflate at three times the inflation rate of employee earnings. Wages rising at 2.5% and house prices rising at 6-7%, guarantees that the market will shrink.
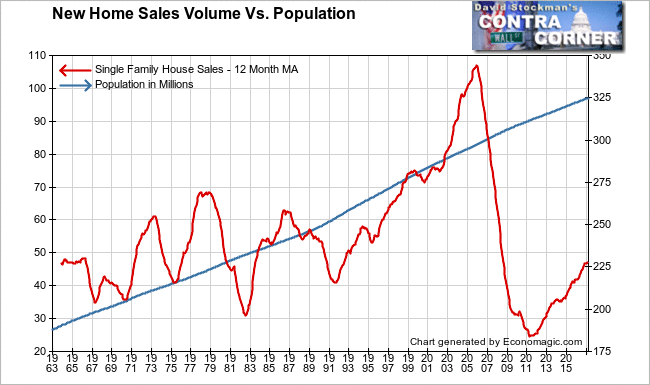
Next, here’s a chart of new home sales over the long term versus population growth. How does that look? Let’s bend over backwards to look at this positively. We had a bubble and it’s not fair to compare sales to peak bubble levels. But even given that, sales are only slightly higher than the level they reached at the bottom of the 1991 recession. The US has about 25% more people today than in 1991. Sales should be a lot higher. This again points to the growing affordability problem.
The next chart normalizes sales by population to the rate of sales per million people. All things being equal, that should fluctuate in the same range over time. But all things aren’t equal. The Fed prompted a crash in 1982 with draconian interest rates. The crash broke the bottom of the range of about 180 to 300 sales per month per million (SPMM) people. It didn’t take long to recover to that range. And with the brief exception of the 1991 recession, sales stayed within that range for the following 20 years.
Then the Fed promoted a bubble. And sales broke out. Mainstream economists thought that we had reached a “permanently high plateau.” But anyone with an ounce of common sense was calling it what it was–a bubble. There were countless thousands of us publishing websites and posting on message boards who repeatedly warned from 2003 to 2006 that we were in a bubble and were going to crash. After the market did crash, the economists all said that nobody saw it coming.
When the market crashed, SPMM went from an all time high in 2006 to an all time low in 2011. It is still not back to the normal range after 6 years of recovery. It has barely reached the level it reached at the bottom of the 1981-82 crash.
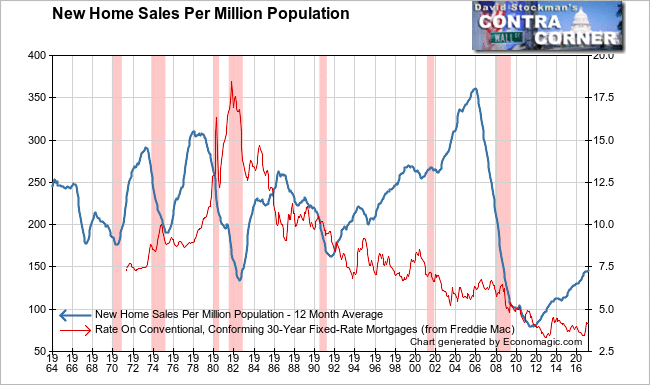
The Fed caused the 1981-82 collapse when it raised interest rates to the stratosphere and mortgage rates rose to 18%. The Fed was trying to break the back of wage inflation and consumer price inflation. It succeeded.
In the current recovery, it has attempted to stimulate housing by printing money and keeping mortgage rates near historic lows. It has utterly failed. Had the Fed not pushed housing prices higher by driving rates to zero, the housing market would have done just as well, if not better than it has. Printing money does not drive growth. It merely distorts. In this case it drove raging housing inflation. That increased the principal component of the mortgage payment while reducing the interest portion. That benefitted sellers, not buyers. Their monthly mortgage payments actually went up, driven by price inflation.
In fact, the incentives became so skewed that builders simply stopped building homes priced below $200,000. At today’s median household income of around $56,000, using typical qualifying ratios, the affordability limit for the median income is slightly above $200,000. That means that nearly half of American households can’t afford to buy a new house.
In addition, builders won’t build houses that those below median income could afford because they make much more profit selling more expensive houses to fewer buyers. In fact, as new house prices inflate, land prices inflate with them. There may be no profit left for builders if they try to build smaller, less costly homes. Their fixed costs are still rising. So in spite of their lower carrying and construction interest costs, builders won’t build in the low price range because there has been too much inflation. This is a direct result of the Fed’s ZIRP driving asset inflation.
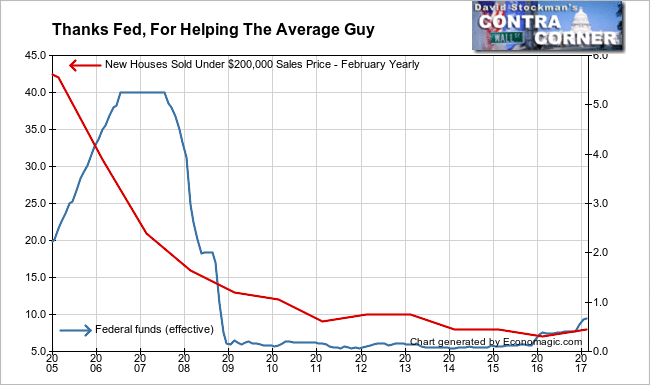
The bottom line is that lower income families can no longer participate in the “American dream,” which starts with owning your own home. We can thank the Fed for that.
Builders have found the sweet spot in the market in the $200,000-400,000 range. That’s where they sell the most houses and make the greatest profits overall. February sales have now stalled at 25,000 units for the past 3 years.
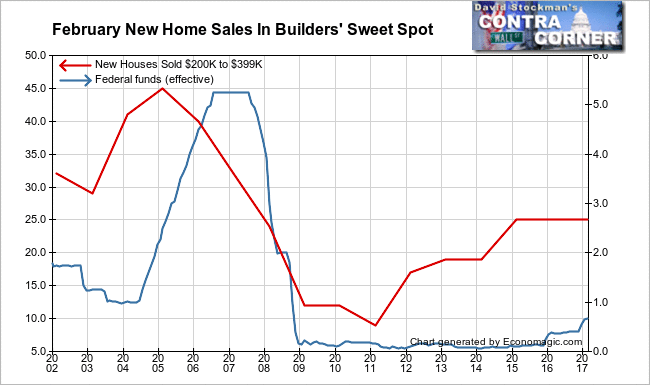
The sluggish market in this price range is a bad sign. It suggests that demand is near exhaustion as the affordability problem rears its ugly head. The rise in mortgage rates is taking a breather. If the uptrend in rates resumes, as seems likely, that will all but choke off demand in this price range. The builders will be in big trouble. It’s a good case for short selling the homebuilding sector. I always rely on the stock price charts to make the timing decision.
Follow Lee’s weekly market timing reports, including ETF trading recommendations, in the Wall Street Examiner Pro Trader Market Updates. Currently open picks have an average gain of 3.8% on a cash basis, no leverage, and an average holding period of 31 days. Try the service risk free for 90 days.


