In the game of beat the expectations, new home sales won one this month, but the outlook is grim. The headline number came in at 592,000 versus the consensus guesstimate of Wall Street economists of 593,000. The headline number is usual fiction of the annualized version of a seasonally adjusted representation of reality.
In this process, statisticians attempt to smooth out seasonal patterns to derive a number that looks like the actual underlying trend. Sometimes it does and sometimes it doesn’t. It’s impossible to know unless you look at the actual data over time. Which raises the question of why they don’t report the actual data. Even if they don’t report the actual data exclusively, they could at least report it along with the seasonally adjusted impressionist art.
In actual, not seasonally adjusted (NSA) terms, the Commerce Department reported that 41,000 units sold in November, a drop of 4,000 from October. That’s a middling performance for November. November 2015 saw a decline of 3,000. The average November decline over the past 10 years was just under 5,000 units.
The annual growth rate was 13.9%. That’s a little slower than October’s 15.4%, and down sharply from the September annual growth rate of 25.7%. That said, a gain of 13.9% is nothing to sneeze at.
My guess is that the relatively solid sales numbers for November were driven by fear, as the November surge in mortgage rates motivated fence sitters to get their rear ends in gear and sign on the dotted line. By doing so they could lock in a mortgage rate now rather than later, when rates are expected to be higher.
New home sales are counted when they go under contract. The NAR’s Existing Home Sales data is reported after the sale closing. The new home sales figures are a little more timely, and far more timely than Case Shiller (CS) which is reported with an additional one month delay.
CS compounds that weakness by reporting the number as the average of closed sales of the 3 month period that ended 2 months ago. Considering the time it takes to go from contract to closing, CS ends up with about a 5 1/2 month lag by the time it is released. Conversely, contract data on new home sales represents the market as of one month ago. It’s probably the best data on the current state of the market.
The continuing rush to is real. But in my opinion, under the conditions where the turn in mortgage rates looks like that too is for real, today’s sales will rob from tomorrow’s. In the wake of the current number, sales should be depressed in the months ahead.

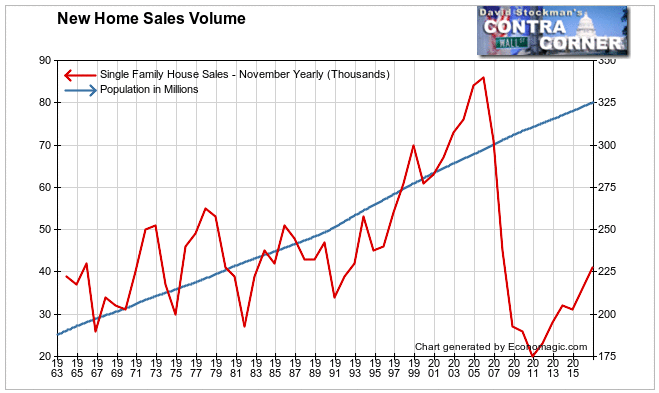
It’s also important to keep things in perspective. While new home sales have doubled since the bottom of the housing crash they’re still less than half the rate they were at the top of the Great Housing Bubble of blessed memory. They’re only at the same level as during the 3 decades from 1963 to 1993. The US had 70 million fewer people in 1993 than today. In 1963 there were 140 million fewer. That tells us that something is deeply wrong with the US economy.
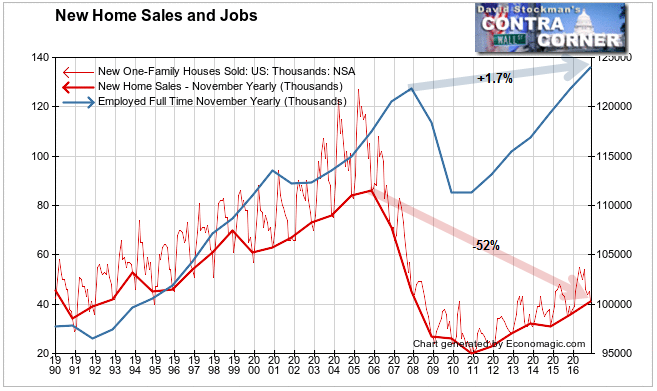
During the 1990s through the later years of the Great Bubble the number of new homes sold tracked in the same direction as the number of full time jobs. That relationship broke when sales volume broke down in 2006 as the bubble was topping out. Jobs didn’t follow until 2008. I like to say that employers are always the last to get the news. They tend to take their hiring and firing signals from the stock market. It was about a year behind the housing market in topping out and rolling over.
But employers caught up with the news and started making news in 2008 and 2009 when everything else was going south. 2010 was terrible in the jobs market, staying flat at an extremely depressed level. New home sales fell further that year, not bottoming until the end of the year.

As the number of full time jobs began to increase in 2011, new home sales followed. But while the number of full time jobs has gone up by 1.7% since peaking in 2007, the number of new home sales are still down by 52% since peaking in 2005.
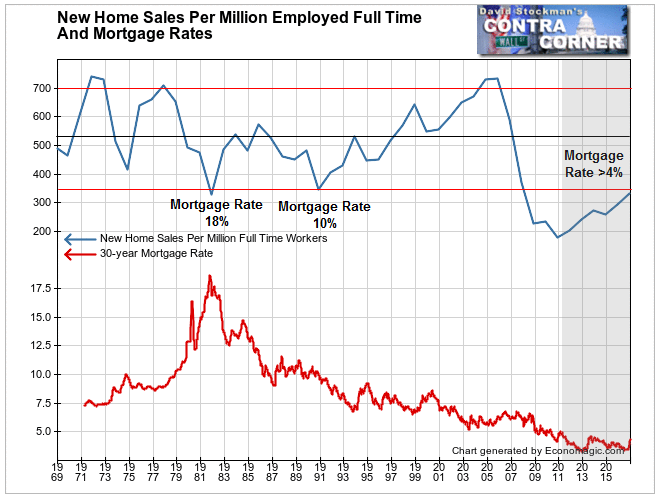
Another way of looking at just how weak demand for new homes is, is to look at sales as a ratio to employment. In this case I show it as sales per million full time employed workers.

From 1969 until 2008 November sales always ranged from just below 350 sales per million full time workers, to around 750 per million. That was true even when mortgage rates hit 18% in 1981. This November, with mortgage rates climbing but still below 4%, sales were still no better than the previous lows, when mortgage rates were multiples of what they were in November.
The reason is obvious. It is the widely covered story of new job creation being mostly in low wage sectors, leading to stagnant household income for the bulk of wage earners. Here in late December the 30 year mortgage rate has reached 4.3%, up from an average of 3.7% in November and around 3.45% from July to October. With fence sitters now having jumped, and mortgage rates not likely to back down much, new home sales have now probably peaked for this cycle.
Builders are already beginning to make adjustments. They remember the fallout from the last cycle well. They moved much too slowly in response to the end of the Great Bubble. They don’t want to make the same mistake in the Zombie Housing Bubble. Consequently they are already moving to adjust their product mix and pricing to the coming reality. November sale prices are down 3.7% year over year.
Buyers and sellers in the resale (existing homes) market have yet to get that message. But if builders persist in lowering their selling prices in response to higher mortgage rates and the threat of lower sales, the existing home sales market should respond in kind within a few months. Mortgage collateral values will fall, and the financial crisis will burst out from behind the wall of paper created by the Fed and its central banking cohorts.
Timing is always the issue. The seeds of destruction have been planted. Their poisonous weeds should sprout next spring.
Happy New Year! I’ll see you next year.


