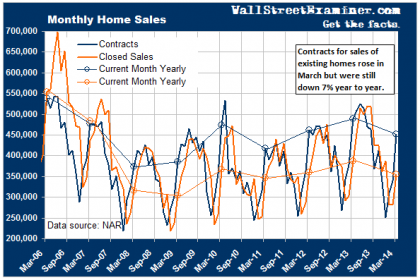
The actual, not seasonally adjusted number of contracts for the sales of existing homes rose by 33% in March versus the February level. This is a better than the prior 8 year average gain for the month of March of 27%. However, it leaves the total number of contracts still 7% below last year’s March level.
Earlier the NAR reported March listing inventory at 1.99 million units in March. That’s up from 1.93 million in March 2013, but still extremely tight historically. Over the past decade, prior to 2012, March inventory was never below 3 million units. The fact that few owners are willing to put homes on the market causes prices to rise, even with historically depressed levels of demand.
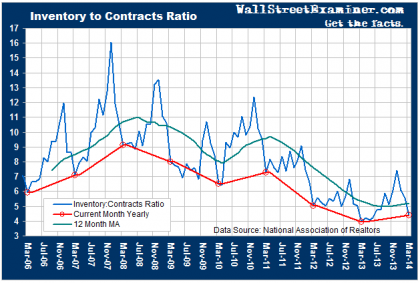
The ratio of inventory to contracts stood at 4.4 in March. That was near a record low of 4.0 set in March of 2013. That ratio was in the 6-7 at the bottom of the housing crash in 2010-11, and at 9 at the beginning of the crash in 2008. But even more striking is that at the top of the bubble in 2006 the ratio was 6. The market is more than 25% tighter now than at the top of the bubble.
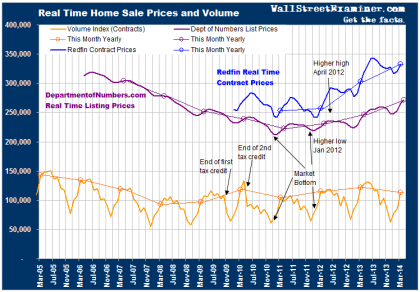
The result is that prices of skyrocketing even with weak demand as illustrated by real time contract data on existing and new home sales. Online realty Redfin.com releases a monthly report on current contract sale prices for the 19 large metropolitan areas in which they have offices. These are the premier markets in the US, therefore the data represents the trend of stronger markets. The data is widely scattered between eastern and western US. It showed prices gaining 9.9% year over year in March.
DepartmentofNumbers.com collects listing price data on 55 of the largest US metros. Listing prices are real time and historically, subsequently released lagging closed sales data shows that the trend of listing prices accurately represents the trend of closed sales prices, with listing prices having a fairly constant margin above sale prices. This data show that listing prices as of late April were 10% above those of a year ago.
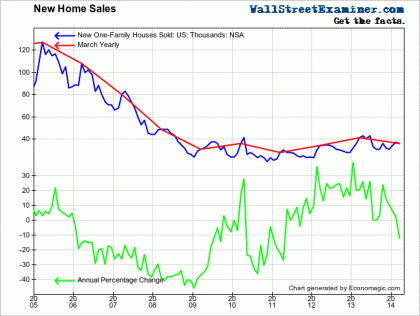
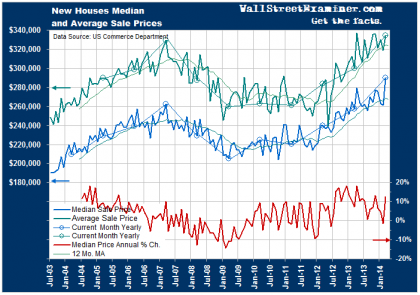
Last week the Commerce Department released its survey data on new home sales. This is based on current contract data, therefore it is also a good, near real time indicator of the trend. New home sales are down more than 70% from peak bubble levels and remain near the lows recorded at the bottom of the crash in 2009-2011.
While new home sales remain extremely depressed, new home prices are zooming higher at a 12.6% annual clip.
The US housing market’s raging inflation without recovery of demand epitomizes the extreme distortions caused by the Fed’s policies of QE and ZIRP.

