Stocks had a great day today unshaken by whether the manufacturing part of the economy was growing more quickly or at the slowest rate in 13 months. Confusion isn’t part of the asset inflation lexicon.
In economic news, the U.S. manufacturing sector had its best gains since October, according to Markit’s final Manufacturing Purchasing Managers’ Index that rose to 55.1 in February from 53.9 in January.
ISM Manufacturing for February was 52.9, its slowest pace in 13 months. Construction spending fell 1.1 percent in January.
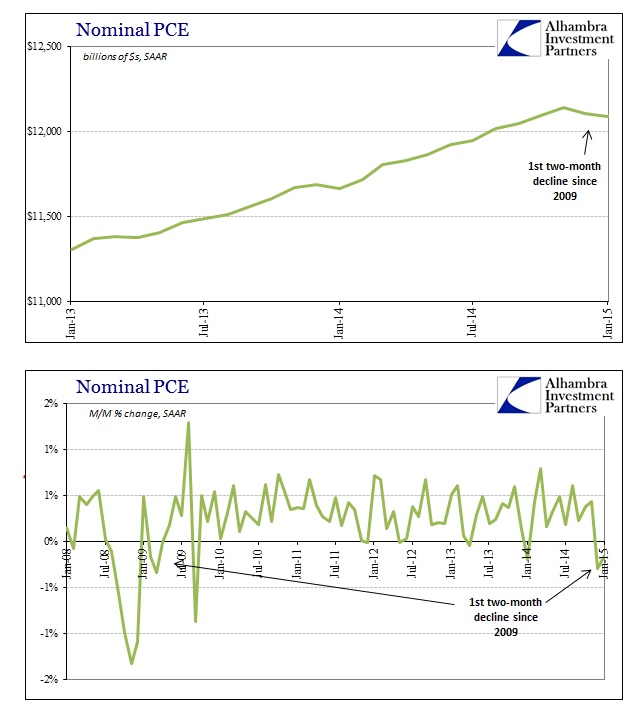
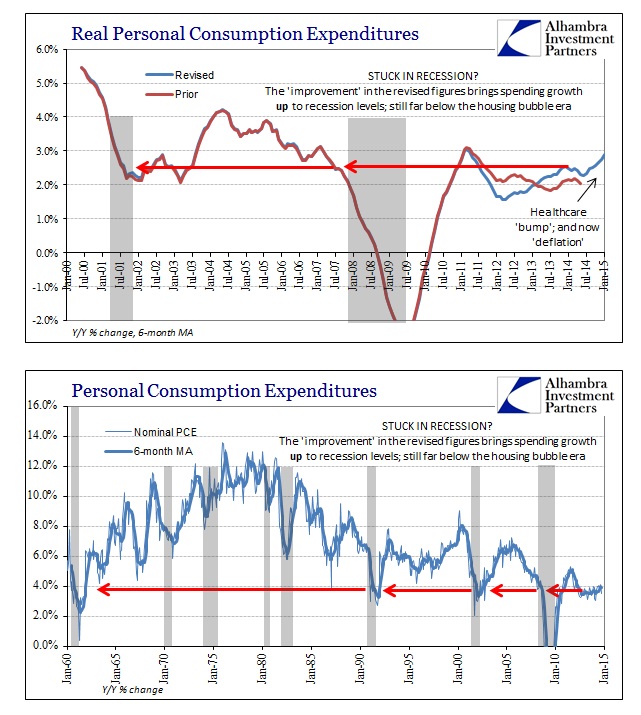
Obviously, nothing of the “bad” news had any much effect on stock prices today. That would include personal income and spending data that was not just worse than expected, it contradicted the very narrative that is supposed to be driving the bullishness in the first place. The collapse in oil prices is purportedly the single best “tailwind” the US economy can get at this juncture, and yet personal spending declined again in January after falling in December.
This was the first consecutive monthly declines, in the seasonally-adjusted figures, since early 2009.
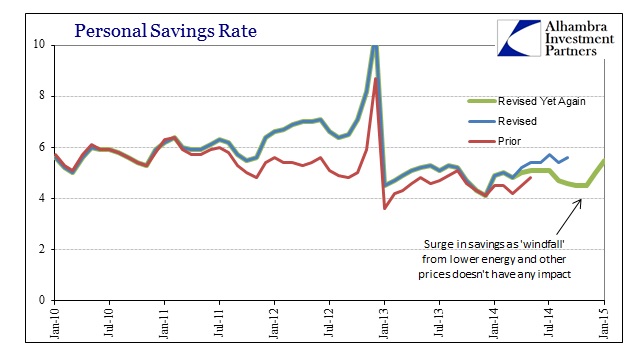
Since personal income was growing at marginally the same rate as the rest of 2014, the net result of the oil “tailwind” is a serious increase in the personal savings rate. The savings rate has jumped a full percent in just these two months!
The reason for the extreme caution on the part of US households, despite the constant and droning emphasis about the “booming” jobs market, is that incomes still seriously lag any other “recovery” in historical memory. Furthermore, the pace of income gains has been far more erratic than anything we have seen of “recovery” periods, let alone of sustained growth.
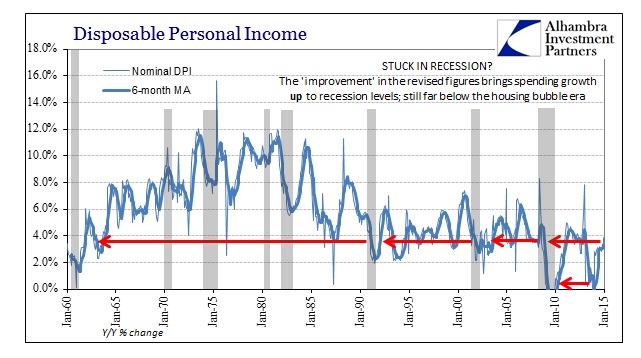
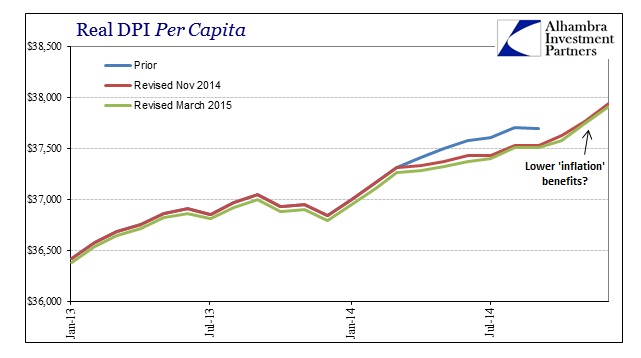
In 2014, year-over-year growth in disposable personal income was just getting back to a level normally associated with the bottom end of a more typical growth year – and it took the “best jobs market in decades” just to reach that low point. Not only that, like GDP, income levels were revised (again) downward in previous years, making the current growth rates (year-over-year) appear to be that much better despite the fact that income is now less than previously though. While that may be good enough for the DSGE models to assume better future conditions, it doesn’t really add that much to households that recognize the vast difference.
Coming after several years of declining income fortunes (which look downright recessionary on their own, starting in 2012, even before further downward revision) you can appreciate why households might be more than skittish about moving toward the unrestrained shopping economists want to see. Thus, low oil and gasoline prices aren’t a bonus they are emblematic of everything else.
That really is the major problem that never blends into econometric analysis, as there exists no coefficient of instability. It is not enough merely to gain some minimum level of income growth, it must be not just sustainable but sustainable in a fashion that causes actual confidence in such an economic trend. Just having Janet Yellen mention a “maybe” booming economy over and over is not nearly enough “stimulus”, as consumers react not to “rational expectations” but actual conditions. In that respect, there is little wonder why spending levels remain so depressed even after almost six years of recovery – it has been one of the most unstable periods in economic history.
Unfortunately, contrary to orthodox economics, this isn’t just simple overwrought emotion that can be “cured” with ultra-high stock prices. Such disparities only heighten the tension as consumers, at least those outside of the day-trading mentality that has been so reborn, remember very well what happens once prices and reality diverge so far and so long. Again, instability takes many forms and that is the only facet this “recovery” has maintained throughout.

