
The payroll and labor data from September is not appreciably different from that of August, despite the large disparity in how each was received. Nothing has changed as far as the inconsistencies in the internal data pieces. The Establishment Survey endures in a straight line as it has for years. The Household Survey continues to undercount such job growth, still by about 40%. Far more important, the labor force is still lower in September than it was in March when all this robustness purportedly began – an incongruity that eats at the very heart of the narrative.
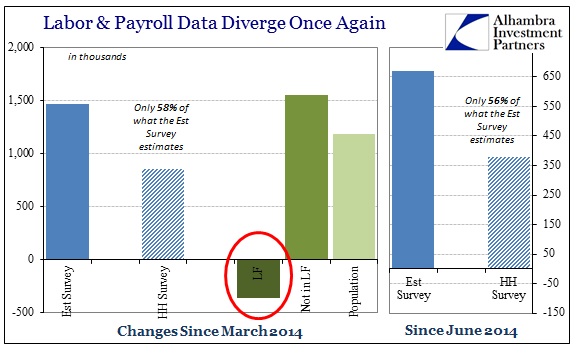
Where the Establishment Survey shows 1.47 million new jobs since March, the Household Survey records only 58% of that, with just 858k (or only 145k per month). For all that, somehow none of it has been sufficient to entice anyone out of idleness.
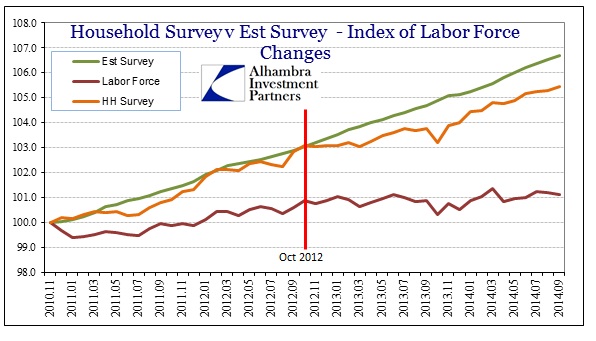
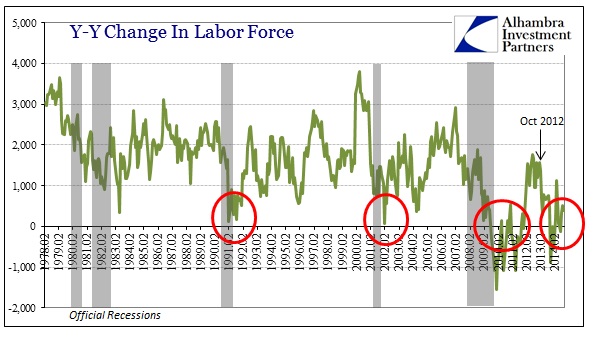
Again, this is not a recent development as there was a clear shift in trends dating back to October 2012. Before that month both the Household Survey and Establishment Survey were in quite agreement on the trajectory of payrolls (which was unsatisfactory even to that point) and the labor force was growing alongside, if only slowly. Since then, the Household Survey has picked up only 59% of the Establishment Survey’s figuring and the labor force itself has been unmoved by anything – snow or the “best jobs market since 1990.”
That has been the rallying point for most of the middle of 2014, where September’s figures have caught up with another “milestone” of sorts. The latest job growth, whatever it may actually be, marks 48 consecutive months of uninterrupted forward progress. That matches the 48 month period between 1986 and 1990, a fact that has been heavily presented today and in advance of this overwrought monthly ritual – though somehow the very clear proximity of cycle peaks to the growing string is left out.
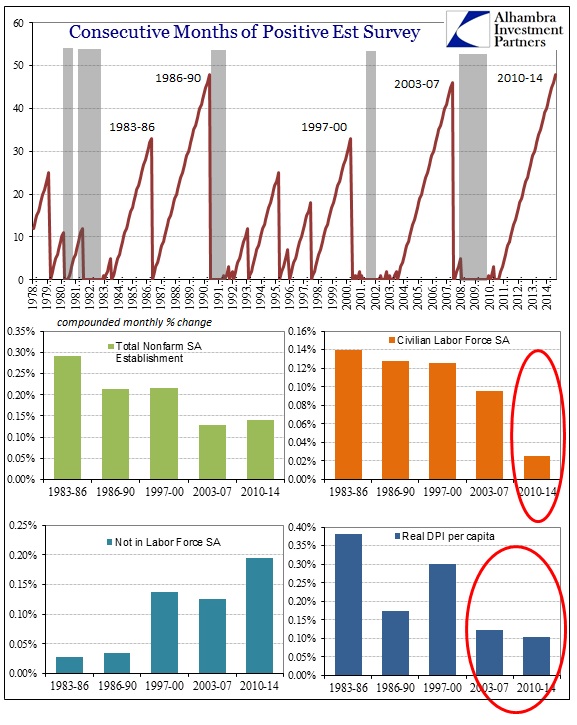
For all that posturing, and that is all that it amounts to, there is clearly nothing much similar between the 1986-90 period and what we see currently other than the number of positive numbers. In percentage terms, job growth is far less now, as is the far more important growth in income. And once more we see that the labor force growth has been seriously devolved in this cycle compared to all others.
In fact, in examining these labor market features like this, it is also clear how much the current “recovery” cycle mimics that of the one coming out of the dot-com bust in 2003. Both featured a curious diminishment in the pace of payroll expansion and the nearly the same deficiency in inflation- and population-adjusted income. The vital difference, and what is left out of all these positive narratives, is that the same deficient recovery following the Great Recession is a travesty given its severity.
That fact, more than anything, provides vital insight into what is taking place with the labor force. A deficient recovery after a severe downturn is going to be a problem as it cannot absorb all those that were displace during the recession phase. In these labor statistics, that shows up as “Not in Labor Force” by simple definition, especially as it relates to “emergency” and “extended” unemployment insurance (if you haven’t looked for work in 6 months they don’t count you as part of the labor force; so if you were on unemployment for more than that you fell out of the labor force entirely unless you started looking for work again, which it is clear most do not).
Looking at the same point from the perspective of demographics, the changing proportion and constitution of whatever is being left inside the labor force shows up as that very macro element . Contrary to the orthodox appeal to those demographics (aging Baby Boomers retiring) it is obvious that people of prime working age have suffered the greatest as a result of the severity of the downturn and the inability of the “recovery” to be a recovery.
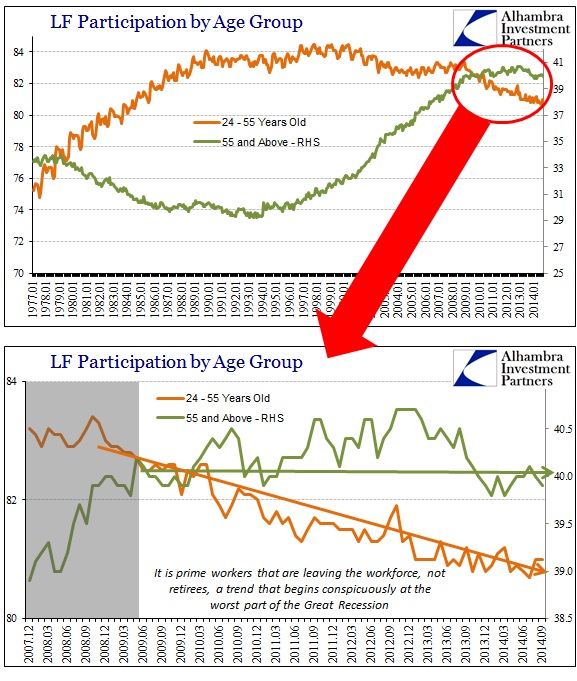
The labor force participation of people aged 55 and above continues pretty much the same as it has throughout this period. If the labor force were flat or shrinking due to an increase in retirees in that age bracket (and why not since the “wealth effect” of stocks is supposed to have an imprint) their proportion of the actual labor force would be shrinking precipitously. However, participation of those between 24 and 55 years old has steadily declined since Q4 2008 when the worst of the downturn struck. That actually continues the trend that dates back, curiously, to the dot-com era and recession.
So we have two recoveries of so very similar nature and proportions, both deficient in these outward manners with the latest even more prominent due to the worst decline since the Great Depression. What might link these substandard recoveries together, coming as they have in the most experimentally heavy age of monetarism?
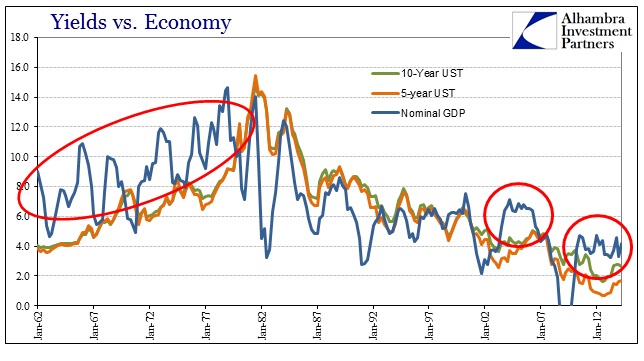
It looks more and more like bond markets have been “right” about growth under these circumstances, particularly as it relates to the insufficiency in recoveries that are so obvious in context. That is a particularly depressing point as it paints the credit market stance in 2014 diametrically opposed to the idea of gaining “recovery.” In other words, stocks may be “buying” the Establishment Survey once again, but bonds are not, also once again.
Click here to sign up for our free weekly e-newsletter.
“WEALTH PRESERVATION AND ACCUMULATION THROUGH THOUGHTFUL INVESTING.”
For information on Alhambra Investment Partners’ money management services and global portfolio approach to capital preservation, contact us at: jhudak@alhambrapartners.com

