With no “unusual” snow or “residual seasonality”, the US economy once again grinds to a halt in Q1 only now with no more reasons to dismiss it. In what has become an annual ritual, GDP barely moves in the quarter immediately following the Christmas holiday. This time, however, it wasn’t just consumers holding back in Q1.
The U.S. economy inched forward at the weakest pace in two years from January through March, as consumer spending growth slowed, business investment plunged and exports declined further.
That suggests broad-based weakness even beyond the “usual” sluggishness of each yearly beginning. It has taken more than a year, but oil prices are only just starting to hit the general capex channel of the economy. But this isn’t to say that it is robust everywhere outside of oil and energy, far from it. As general weakness has set in, it leads to soppiness for commentary:
The U.S. economy grew at its weakest quarterly pace in two years between the months of January and March, government data showed Thursday morning, as consumers and businesses alike showed new caution with their spending.
The nation’s gross domestic product expanded just 0.5 percent on an annualized pace. Businesses cut back on investments with a severity not seen since the financial crisis.
The relatively tepid growth indicates that the economy is still being held back by apprehension and caution — even as global chaos diminishes, employers continue hiring and the stock market recovers from early-year turmoil.
In the second paragraph the Washington Post relates the grim reality of widespread slowing and even reductions, but then delivers the typical mainstream contradiction in the very next. How is that “businesses cut back on investments with a severity” but also at the same time supposedly “employers continue hiring.” Unless employers and businesses are now two separate categories unrelated to each other, writing those statements at the same time and in the same context just does not make sense. Cutbacks and adjustments generally include labor as well as capital, and if the overall capex environment is at least lousy then it is quite unreasonable to assume what the employment statistics are trying to suggest – let alone depend upon them for expectations as to why weakness won’t continue.
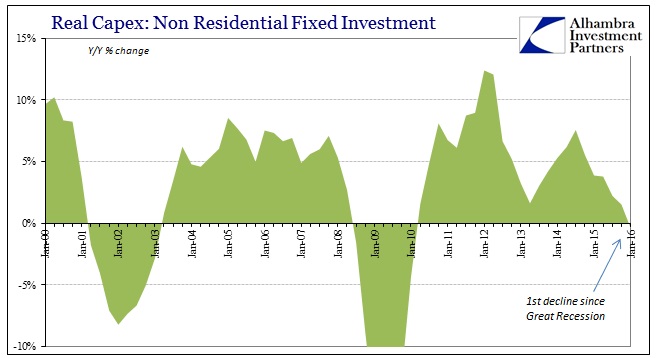
Although we will have to wait for the final GDP estimate for Q1, the prior figures (up to Q4 2015) on the GDP view of corporate profits leave no mystery as to why business investment has slowed significantly or even started to fall off. Like the rest of the economy away from the BLS employment numbers, there is only alarming weakness. Q1 GDP just confirmed it yet again in yet another fashion.
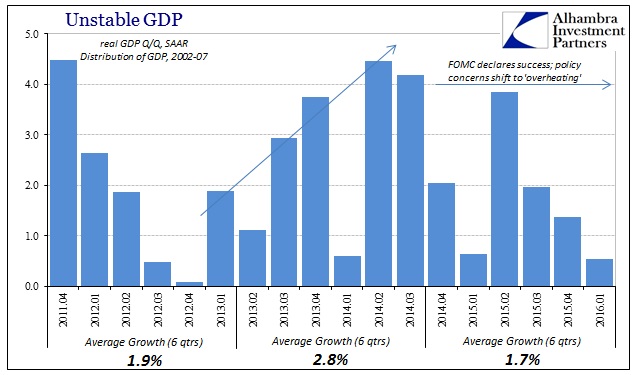
In December 2014, the BEA released its final reading on Q3 2014 GDP, which was revised higher to about 5%. It was the second consecutive “good” quarter and served to convince any economist and policymaker the recovery was over and full growth was at hand. Because of that, the FOMC switched or finished switching to more concern over “inflation” and “overheating.” The average GDP growth in the six quarters up to that point is 2.8% (after subsequent revisions); in the six quarters now since, GDP has averaged a stunningly low (on its own, to say nothing of expectations toward “overheating”) 1.7%. That is worse than even the six quarters during the duration of the 2012 slowdown (1.8%).
Throughout these last six quarters we have been told repeatedly, incessantly that the labor market is strong and that the economy must be, too, especially in terms of consumers. Instead, consumer spending has only slowed and dropped. It only remains somewhat positive due to the services portion of PCE shot full of imputations and estimates. Spending on goods suggests only that consumers are in much worse shape than even the persistently weak overall PCE trend indicates.
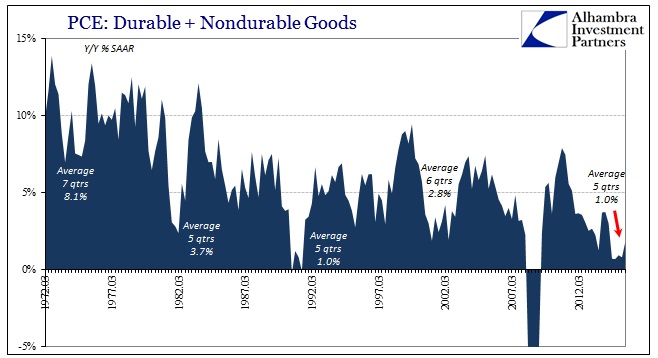
Spending on actual goods, at least from the perspective of the GDP measure of it, is as bad or worse now (totaling five quarters since, conspicuously, the start of 2015) as it was in all prior recessions save the Great Recession. The paltry growth includes auto sales (durable goods) that even though slower of late have been especially robust. If one were to figure the labor market condition using only consumer spending, capex, and corporate profits estimates of GDP you would likely come to nothing close to what is supposed to be still the “best jobs market in decades.” That doesn’t necessarily mean that there is heavy contraction in terms of jobs cuts, only that businesses are undoubtedly being far more cautious than the Establishment Survey assumes (and I do mean assumes).
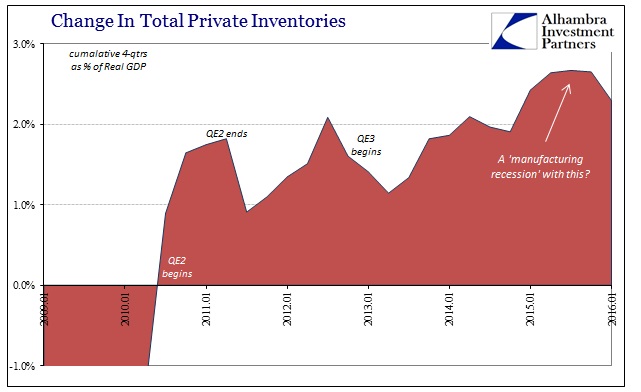
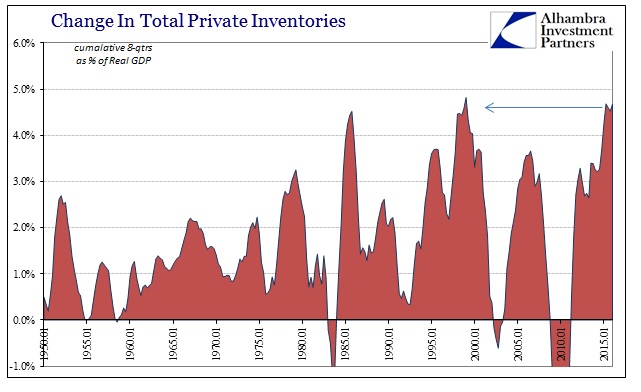
Furthermore, the GDP estimate for Q1 is only positive because inventory continues to grow at a rather solid pace. The initial estimate is +$69 billion, which is the slowest gain in two years, but still an average gain and leaving inventory overall with immense, historical imbalance (especially compared to actual sales or even GDP’s version of them above). In BEA accounts, deceleration (second derivative) in inventory counts as a drag on the quarterly figure (+$69 billion is slightly less than the +$86.9 billion from Q4) but only subtracting 0.33% from the overall Q1 growth rate. In other words, without factoring the necessary slowing in inventory, GDP still would not have been 1%.
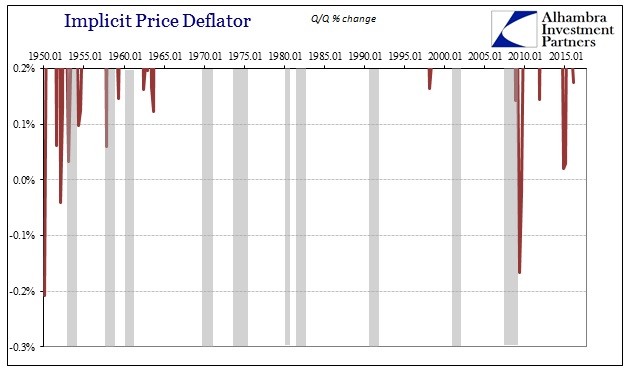
That view was further “aided” by the Fed’s continued inability to meet its inflation target. This is, of course, a qualified blessing as the last thing beleaguered consumers and US businesses need at this moment is for the Fed to finally figure out how to hit its 2% target (though oil production firms, by contrast, would certainly welcome it). On an annual basis, the implicit price deflator picked up slightly to 1.3% but was only 0.17% quarter-over-quarter (meaning the lower quarterly level applied to nominal GDP in order to calculate real GDP). For all the massive “stimulus” and “accommodation” from monetary policy, it is highly conspicuous this further and historically anomalous inability toward “inflation.”
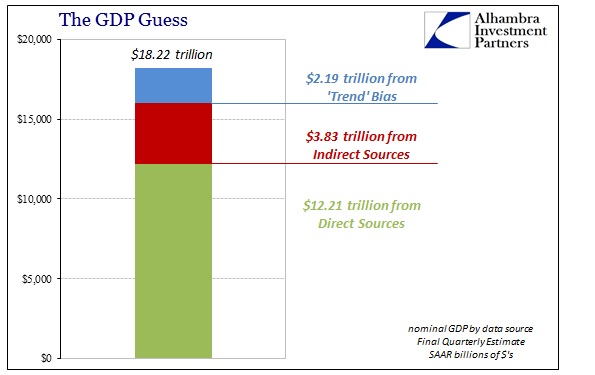
One final reminder, this initial estimate contains far more rough sources and imputations (including trend-cycle) than the final estimate that will calculated and released two months from now. In that version, which I don’t believe will be significantly different than what was released today, there is still a huge proportion of subjectivity, which means there really isn’t enough positive “growth” to be reasonably sure that GDP wasn’t actually negative.
In any case, there was absolutely nothing good in the BEA report especially as it further isolates the view of the economy via the mainstream employment numbers. It may not yet signal recession, but there is far, far more of the manufacturing recession and faltering consumer and businesses than anything of “overheating.”
