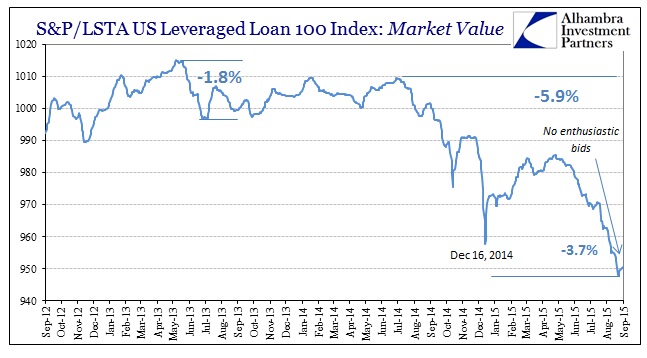
The update to the S&P/LSTA Leveraged Loan Index was pretty much as expected following the interpretations I suggested Friday. Despite the alleviation of direct “dollar” pressure on liquidity subtracting from asset prices, there is a very distinct lack of enthusiasm to, at this point, rebid for margined assets or to pick up “bargains.” The index itself rebounded from a low of 947.85 (market value component) on August 26 to just 950.10 by September 1. However, the index remained almost unchanged from that level all last week (pricing irregularities?).
That is a sharp contrast to the trough of the last time junk credit was so conspicuously under leverage calls dating to December 16. From a low of 957.70 that day, the index had jumped to 970 just three days later, finishing 2014 at 973. For the index to remain pretty much at the lows for almost two weeks (below 952 since August 21) is, I believe, significant.
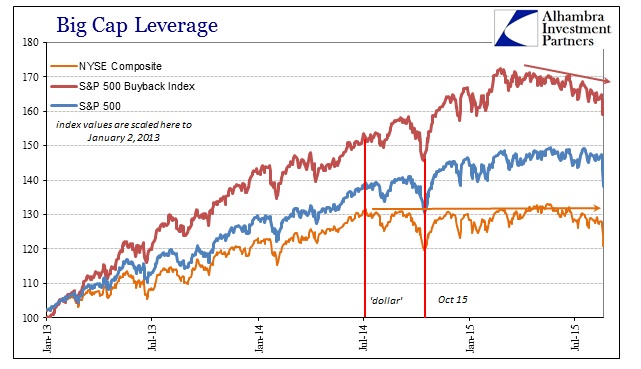
The end game, so to speak, for this junk as the corporate credit bubble overall is in issuance. Once the funding game runs its course into the sustained downswing of the “cycle” the extent of marginal economic as well as financial diminishment is simply unknowable. The size and reach of the corporate credit bubble is immense, beyond much description especially as the huge numbers themselves don’t really illustrate the penetration of this financial bastardization (such as how much the stock repurchase bubble might similarly suffer the fate of marginal economic activity just from troubled companies no longer able to add debt and hang on).
In that sense, it isn’t just about yield. Junk debt is still priced near relatively and historically high levels, which projects those yields, but the prices have been much, much more volatile of late (and in one direction). The combination of those two facets will, realizing that this isn’t just normal market direction, suppress “demand.” That is, in many ways, the “price” of immense institutional sponsorship which reacts to the math far more than any sense of “value.”
The most recent issuance estimates from SIFMA paint a disturbing picture in that regard. High yield issuance was just $7.4 billion in July, the second worst month going back to 2011. The total in August was only $14.8 billion, taking that two-month crash in prices to the lowest issuance in years. Since issuance in June was only $21.2 billion, the rolling three-month sum is also at a multi-year low; below even the huge credit disruption in the middle of 2013.
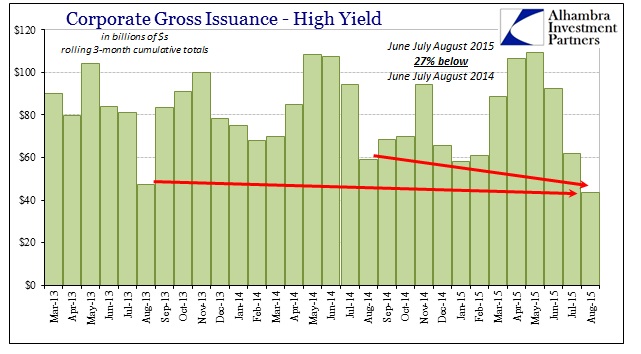
That is significantly less than half (-60%) of the three-month total ended May 2015, and nearly a third less than the “Polar Vortex” fears of early last year.
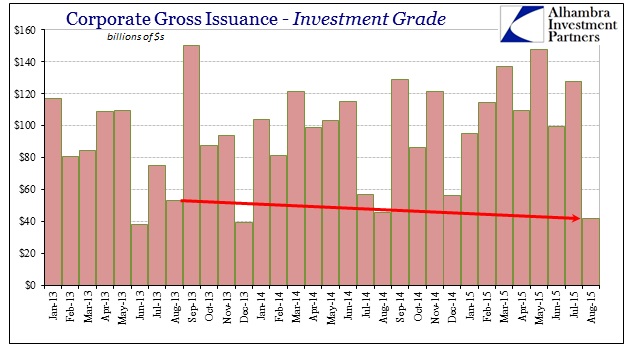
But where this downturn in junk may be expected given spread blowouts and volatility and irregularity in prices, the estimate for investment grade issuance in August was quite surprising. August is not a robust month for corporate bonds in any form, but at just $41.7 billion it was a startlingly low volume. Maybe that was due to the nearly $128 billion issued in July, but whatever the case it was significantly below both August 2014 and even August 2013 (-22%) during the remnants of the “taper” drama.
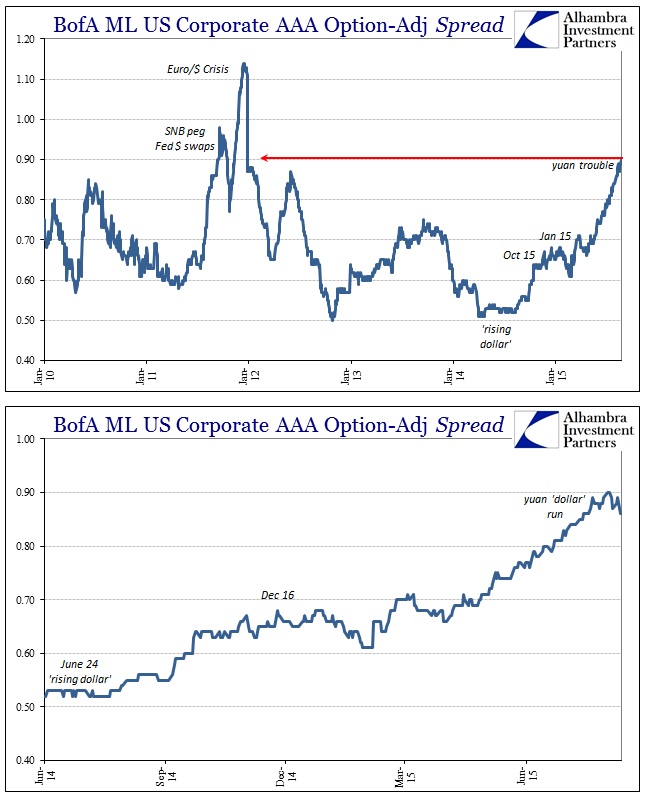
Investment grade spreads haven’t been nearly as noticeable as their junk counterparts, but they have been moving steadily upward. By count of the BofAML Option-adjusted spread for AAA bonds, the pricing disruption is as large as when the Euro/”dollar” crisis kicked into overdrive in September 2011.
It is, obviously, far too early to say whether the corporate issuance has reached a true cycle inflection. However, given the realities here and how they have progressed since the “dollar” started “rising” it is quite different from 2013 when the corporate bond bubble shrugged off huge variation. Maybe that had to do with the fact spreads into 2013 had been rising since QE4 but under largely opposite interpretations – that the recovery had been achieved. A lot will depend on liquidity in the weeks ahead, but we also have to now consider general volatility perceptions and their place within the framework of general risk in a world turning out quite universally “wrong.”
Awash in continued and growing downside risk, these financial imbalances accumulate into general business and even consumer expectations and settings. That is why the Fed seeks to influence if not “control” asset prices as a general economy measure. But where that doesn’t really work, you cannot fake a recovery, downside expectations are very real (unearned optimism from bubble prices don’t translate, but uncertainty and fear from the bubble turn really and truly do). In other words, these are perhaps nails on the recovery coffin, and they are becoming quite plentiful.