I think the ongoing destruction in the Japanese Household sector demonstrates very well a specific shortcoming about economic statistics like GDP. The basic calculation of the particular measure that forms the headlines of almost all commentary is a comparison of the current quarter to the previous one. That right away opens the door to incongruities as there remain very definite seasonal differences between quarters. Orthodox econometrics has decided that this seasonality is easily defined, so it adds its own formulaic adjustments to make each quarter “apples to apples.”
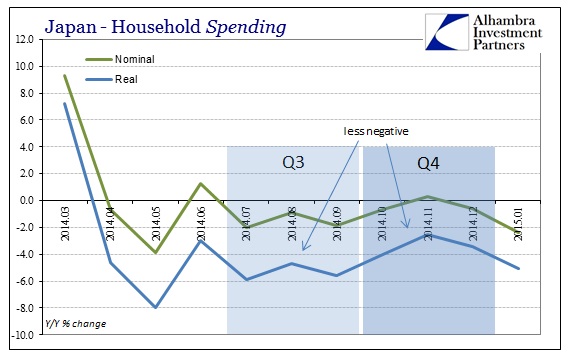
Even setting aside whether such adjustments can ever be properly defined let alone measured, that still leaves GDP as a function of second derivatives within each quarterly change – second derivatives that could very well be influenced by what econometrics believes as “random” errors even in seasonality. In terms of Japanese household spending, there is a clear vicious trend at play, but in GDP terms household spending has added a positive contribution to the whole for the past two quarters!
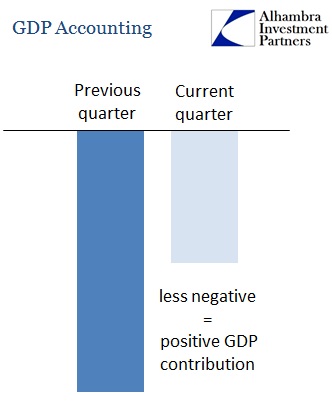
The calculation that twists the signs is that building upon second derivatives. Because household spending was “less negative” in Q4 than Q3, but still negative, household spending “contributed” +0.6% to that overall +2.2%.
Typically, that is not such a problem as usually a change in second derivatives of that kind is the beginning of trend that will in short order lead to a positive number rather than just a positive contribution. But we live in extraordinary economic times, whereby it is entirely conceivable that household spending (and maybe not just in Japan) continues to be negative for more than any short term. As long as that gets “less negative” quarter after quarter this overall contraction will be a “positive contribution” to GDP.
Economists don’t much worry about such an outcome because they don’t believe it a likely possibility, and so GDP despite this shortcoming remains as it is and interpreted as such. So they don’t wonder what GDP is actually measuring as conventional wisdom continues to simply take the number at face value. Like the unemployment rate that draws down almost exclusively via the denominator, simply accepting these figures can be misleading; and highly so.
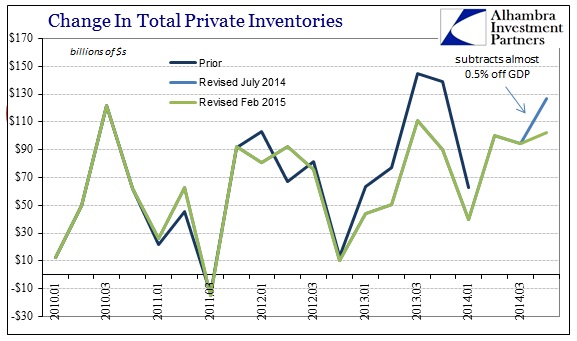
This second derivative problem is most acute in inventory calculation. As the latest revisions to Q4 GDP for the US show, inventories “contributed” about half a percent less to overall GDP than first thought at the preliminary figure. Along with a downward revision to fixed investment (which is much more relevant), Q4 GDP suddenly comes in at just 2.18% instead of the already-disappointing 2.64%. Inventories still grew in Q4, by an astounding $102 billion over Q3, but second derivatives swing in both directions.
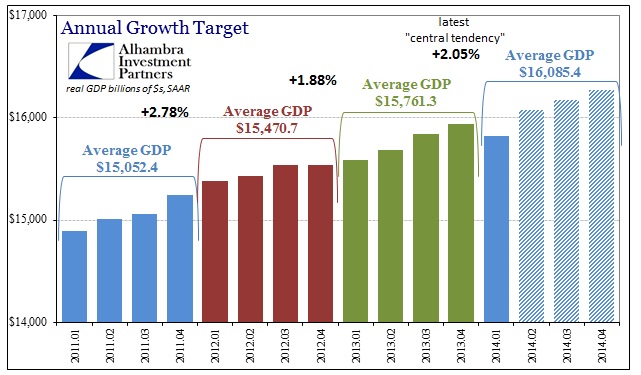
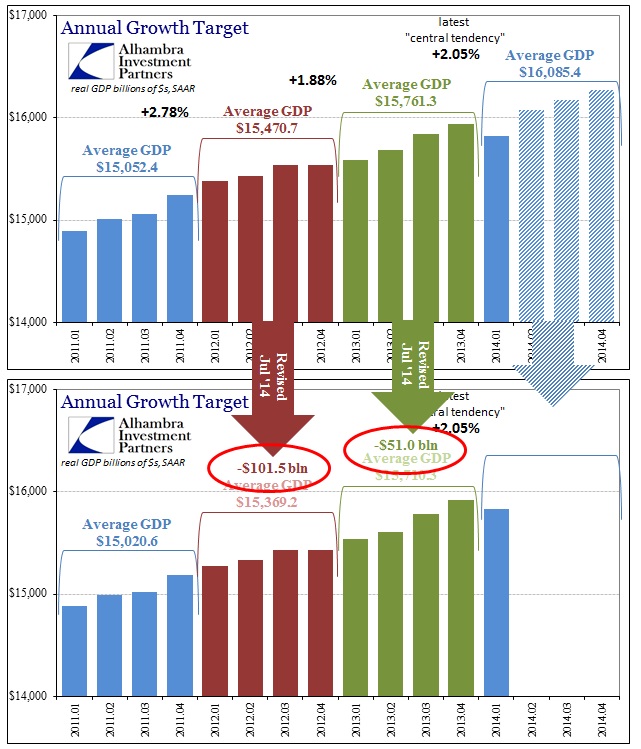
By most accounts, GDP was one of the two major economic figures pointing to Janet Yellen’s version of economic revival. The latest revisions put a serious dent into that, but overall 2014’s GDP was slightly better than expected all the way back when Q1 was being fully ignored as an “anomaly.” At that time, given the GDP numbers in hand, to reach just the minimum level of the FOMC’s “central tendency” expectations would have required an average annualized real GDP of $16,085.4 billion.
While Q2 and Q3 (carried over into Q4) came in much better than expected on healthcare spending more than anything, demonstrating yet again why there is no such thing as “aggregate demand” as some spending is more efficient and contributory than others, there were massive revisions to prior years released in July. The net effect of those was to significantly shrink the economy we thought we had had in 2011 and 2012. The reduced baseline there made even 2013 that much smaller.
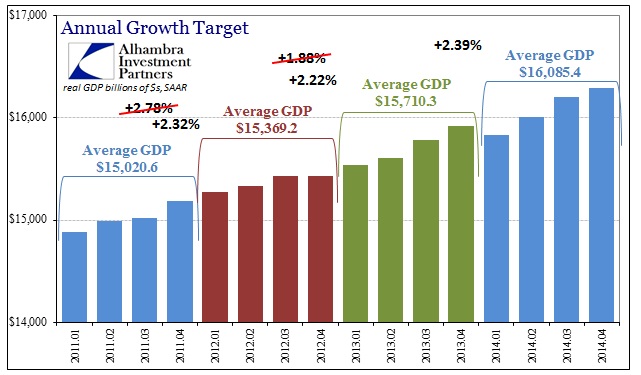
Now with 2014’s updated Q4, we can address the overall yearly advance. The average growth rate in 2014 is (until the next revision anyway) $16,085.4 billion. That is not a misprint, as the average growth rate is exactly what was calculated eight months ago to reach the FOMC’s central tendency.
But instead of being at the extreme lower end of that central tendency range, 2014 is now a little bit above it. In other words, despite being the exact same number as the initial target, GDP growth in 2014 is 2.39% rather than 2.05% – defining being above the past two years rather than being below them. But the economy did not actually grow more than we thought, the BEA just revised away the economy we thought we had before. What has really changed is just perception, even though, by GDP, the economy now is just as big as we thought it was (or was going to be).
In more practical terms, however, GDP is pretty much the same as it has been throughout this recovery. That inevitably brings my good friend Fred Everett to try to pin me down about the next GDP report in the context of such stagnation which amounts to attrition – to which I replied only partly in jest that I anticipate GDP for Q1 2015 will be between -4% and +8%. Seriously, I don’t know how anyone would even try to predict. The current “tracking” models estimate it at about 2.5%, but they had the same estimate at the same time last year and missed it by -4.5. We don’t know what inventory will look like, which, again, is extremely volatile and already quite high, nor the imputations (which are growing). Beyond that there is the deflator, which will be very low “helping” GDP and then second derivatives about net exports and gov’t.
The parts that actually count for something meaningful aren’t doing so hot, but GDP doesn’t care about that. Commodity prices and credit markets matter more to me than any of these numbers, but I do find that wages and retail sales (and capital goods) all suggest more trouble than anyone will admit, which is why there is so much emphasis on the perception of the GDP figure.
On April 30, 2008, the BEA released its first estimate of GDP for Q1 08 at +0.6%. Now that was bad, but it wasn’t anything too serious and it re-assured any number of economists since it matched the then-estimate for Q4 2007. FOMC participants in particular were relieved as it looked like the economy had stabilized despite the “shock” of late 2007 (we know this because they talked about it at the June 2008 meeting where they were busy updating their projections and talking points to say the “worst was behind us”, or as Bernanke said that May, the “risk of a serious recession has diminished”). This was the same quarter that saw Bear Stearns fail and the financial system experience the first full phase of the panic – with the geographical liquidity divide growing more than harsh (sounds familiar).
But for all that “market” chatter, which it was set aside as being, GDP was reassuring to the “right” people who could trumpet its “resiliency” when just opening your eyes showed the opposite. Never mind the clutter of how GDP is constructed, calculated and always, always revised, all that mattered was the perception.
The BEA now estimates, after many revisions, Q1 08 GDP at -2.7% which fits that time far more than +0.6%. If they had come out with -2.7% contemporarily, which would have been the worst GDP quarter in two decades, it may have changed the entire face of that period – and maybe saved a lot of people from going over the cliff by listening to economists. I don’t necessarily believe we are going off a cliff in economic terms right now, though recent bank behavior and commodity markets are not so reassuring, but I don’t think it unrealistic to say that we may be much closer to a cliff than the economy imagined by Janet Yellen and her compatriots using GDP. Some things may never change.
What matters of GDP is that it still exhibits so much instability which is a signal, since GDP is constructed most favorably to show the most growth, that the economy isn’t so robust.

