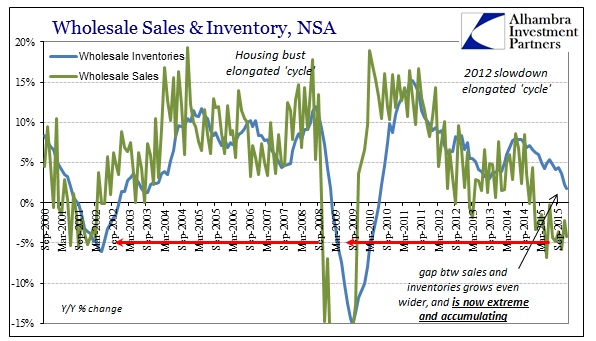
The wholesale level of the supply chain continued its divergence, though it seems increasingly likely that inventories have at least rolled over even if they are still building. Sales fell by 4.2% unadjusted year-over-year while inventories were up only 1.8%. That was the slowest inventory growth since the summer of 2010, but it still leaves the inventory gap as unbelievably wide.
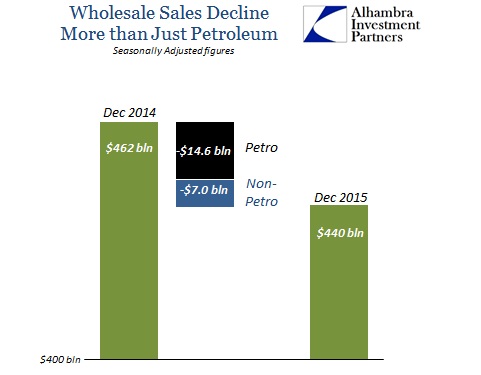
Petroleum is still blamed as the extent of the growing discrepancy, but the wholesale level is broadly shrinking even outside of oil prices. Total wholesale sales were $461.7 billion (seasonally adjusted) in December 2014 but only $440.0 billion in December 2015. Of that $21.6 billion decline, wholesale sales of petroleum accounted for $14.6 billion, meaning that non-petroleum sales declined by just less than $7 billion. A healthy economy produces +5% to +10% in wholesale growth with or without oil, so sales growth overall ex petroleum less than that is concerning; -1.7% is downright recessionary.
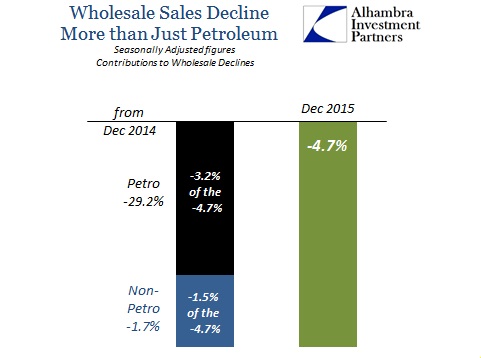
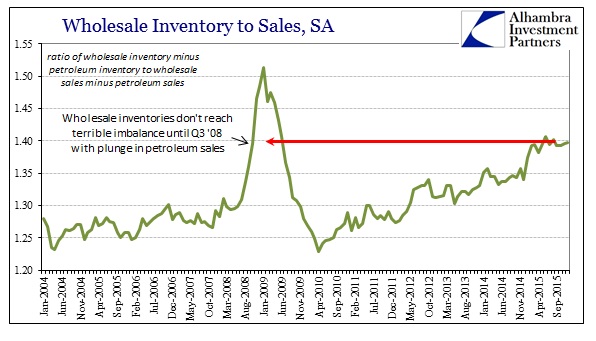
Wholesale sales ex petroleum had been flat since late 2014 (concerning), but have in the past few months started to decline precipitously (recessionary). That would suggest that inventory levels non-petroleum are starting to feed into the overall decline as the inventory-to-sale ratio remains significantly elevated but hasn’t grown appreciably worse. In other words, the economy may be working out of that pre-recessionary adjustment phase into more traditional recession footing. Given the extreme in inventory, that is not a particularly welcome transition except as it may represent the inevitable.
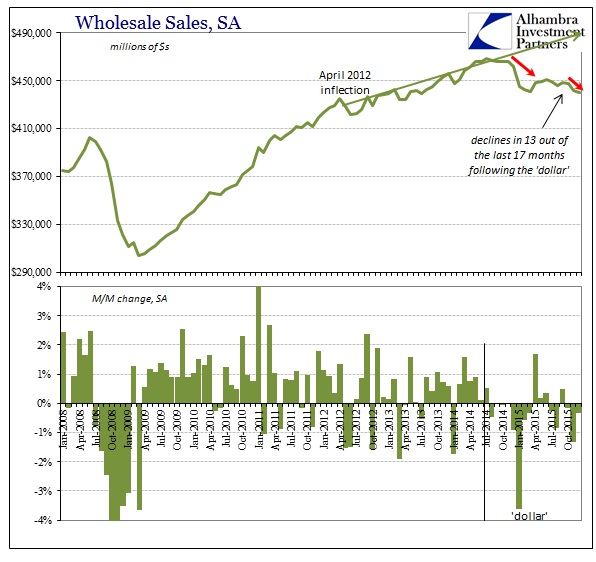
The problem, again, is the scale of the inventory imbalance; we have never seen anything like this before. The oil sector and petroleum is clearly contributing to the divergence, but the length and breadth of the inventory departure is far more than that and far more than historical precedence. In the past, wholesale sales and inventory enjoyed a close relationship which only makes sense. Recessions were any sustained divergence between them, as sales declining would produce a lagged effect on inventory (down and up). Historically, that lag has been rather short, at least in comparison to now, as recession typically took the “V-shape.” Businesses tend to liquidate once the overall impression and environment turns.
The past two cycles show that close tendency quite well, as sales and inventory turned at each inflection with at most 6 months delay.
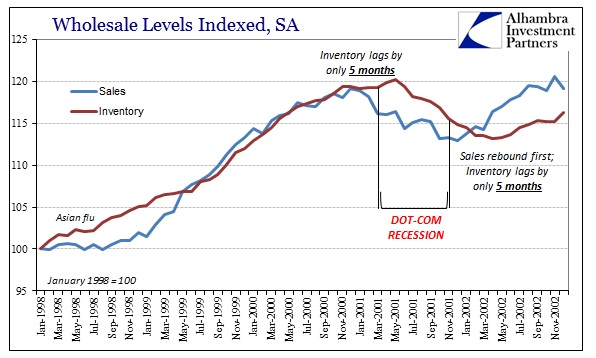
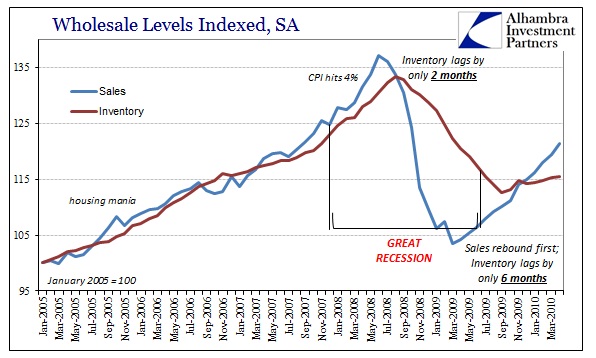
The current lag has pressed on for about 14 months by the seasonally-adjusted figures. If those are close to accurate, then the inflection in wholesale sales began in August 2014 while inventory continued forward until September 2015 – a span of 14 months (inclusive of August 2014). At most, the first few months of that divergence can be accounted for as more so the oil price effect on wholesale petroleum sales. Again, as noted above, non-petroleum wholesale sales have stagnated for the past fourteen months (December’s 2015 sales level is slightly less than October 2014). Despite that, and with oil pressures only increasingly more broadly, inventory continued to build for at least a year overall.
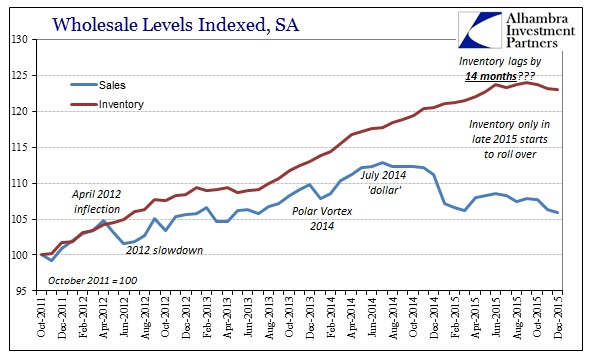
Comparing the last three charts above truly shows just how far out of alignment the current situation has become. This is, again, unprecedented; not just in terms of time but really magnitude. Unlike 2008, where the inventory-to-sales ratio quickly turned higher than what we see even now, this situation is in some ways more dangerous. At least in 2008 the rising discrepancy was as sales were collapsing quicker than inventory in the typical recessionary arrangement. In 2015 heading into 2016, the rising ratio is due purely to rising inventory directly against those falling sales all throughout the supply chain.
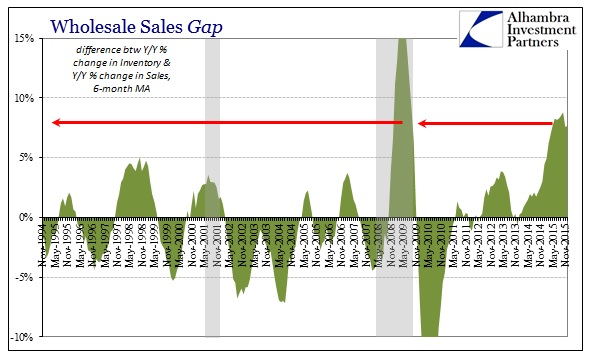
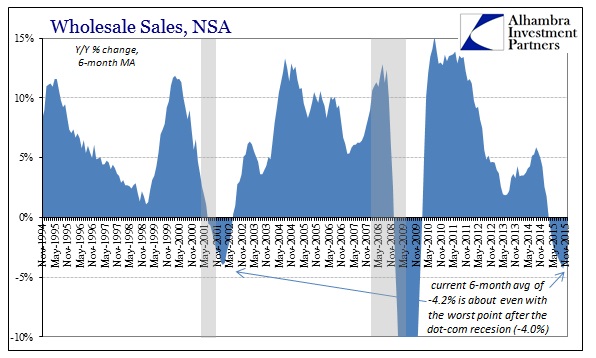
That leaves the economy in a quite precarious position where it has already weakened significantly in production cutbacks as growth in sales throughout have slowed and declined. However, those cutbacks haven’t achieved even the slightest improvement toward restoring economic balance between sales and inventory. We’ve seen more than a year where inventory accumulates as sales fall off; how quickly and intensely do they converge again?
The problem isn’t just simple math in terms of inventories that “need” to decline by the same amount or slightly more than sales – there are feedback effects that are just waiting to be presented. In other words, as production scales back more severely to more closely align inventory, that will only further pressure sales as those cutbacks will undoubtedly involve labor utilization and undoing some (or a great deal) of the progress from the inventory side. That, of course, will lead to even greater production cuts as the process achieves more drastic and desperate magnitudes on both sides through these feedbacks; and so on.
What these wholesale figures show is that it does appear that end process has started though it has a long, long way to go to produce more sustainable and fruitful balance; even before the feedback effects. That would seem to match the increasingly desperate and negative perceptions from asset markets, funding in particular. With the direction increasingly in place, the focus of analysis is to delta and gamma – how fast, how far, how long. It is truly astounding to just be reaching that point after more than a year already.


