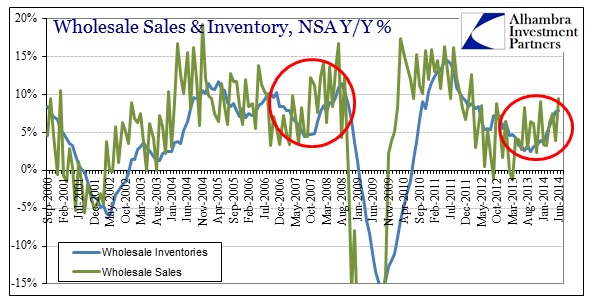
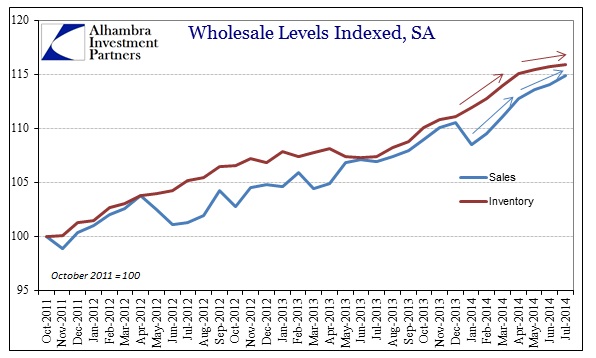
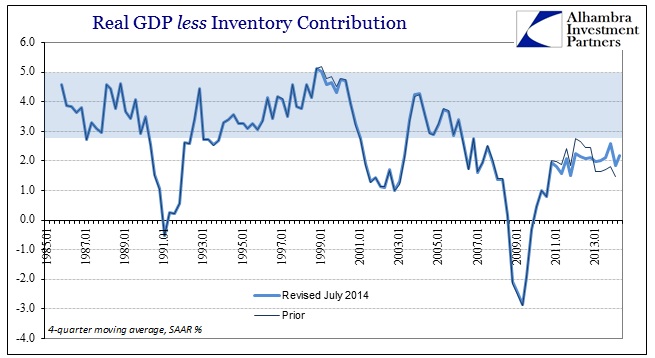
The wholesale trade figures still confound both the “rebound” narrative and the drastic revisions of GDP made in July. The broader context of wholesale trade remains as it has been since early 2013, as although growth appears to be increasing it is doing so at a deficient rate. That counts for both inventory and sales, though there is, I believe, more going on than just what these figures suggest.
The similarities between the current period and that which preceded the Great Recession are a reminder of how much inventory is unsettled around economic inflection. The fact that inventories gain is not necessarily a signal of optimism in the supply chain, as inventory calibrates badly to changes in demand at these points. It may be hard to determine of the chart immediately above, but it was wholesale sales that led inventory higher heading into the Great Recession. Currently, sales and inventory are much more aligned.
The unique position of wholesalers in between production and retailers means that there are other inventory considerations to factor here. Sales could be rising at the wholesale level but leveling off or even declining in retail if retailers decide to hold more inventory in anticipation of a return in demand. That links wholesale inventories to not just wholesale sales, but retail inventories as well.
In terms of pure nominal inventory, going back to the middle of 2013 retailers suddenly picked up inventory that seemingly has “pulled” wholesale activity up with it – including the proclivity of wholesalers to hold their own stocks. That showed up in the GDP figures as an immense intrusion of inventory “contributions” to “growth” – at least until the July revisions shifted that inventory build into 2014 rather than 2013. Given the latest updated figures, that inventory revision still makes no sense.
Since GDP measures second derivatives, the change in the change in inventory levels is supposed to be what determines GDP “contributions” under the current flawed schematic. Again, the major uplift in inventory clearly arrives in the last half of 2013. The slower accumulation in Q1 somewhat fits with GDP’s deeply negative contribution during the contraction in that period, but according to the wholesale figures in this series the accumulation in inventory in Q2 was almost identical to that of Q1 (inventory grew by $47.6 billion in Q1 over Q4, and then by $47.8 billion in Q2 over Q1; because the rate of increase was the same the second derivative, acceleration, is almost zero). That would suggest no boost to GDP in Q2, and thus contradicting the 1.4% “contribution” that the GDP figures show (at least for now).
Obviously, there are additional data points included in the GDP calculations so the fact that there is not perfect agreement is fully expected. But I would presume to at least find some broader agreement since one (wholesale data) should form a high proportion of the other (GDP estimates for inventory). That the current wholesale figures still look like the GDP estimate from before the major July revisions is troubling.
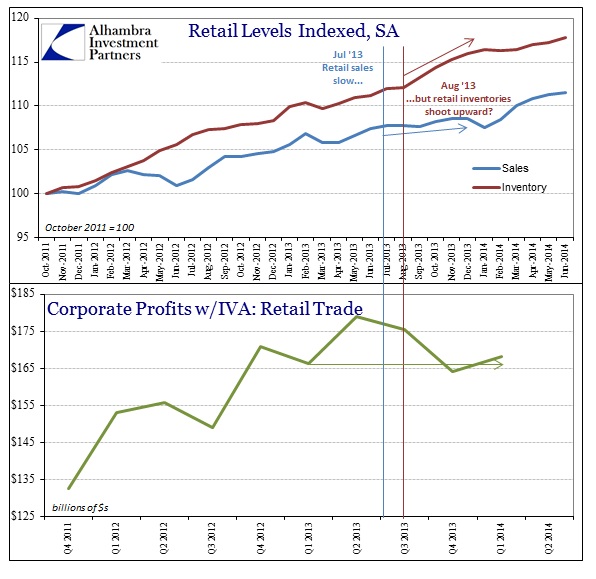
The reason for that becomes clearer in a more detailed look at the inventory changes at the retail level. Again, the retail inventory is seemingly driving wholesale sales and inventory, so changes there become of paramount concern.
What we see is another strange appearance in conduct. Retail sales clearly falloff in growth (almost to flat) around July 2013, coming amidst the bond selloff and uncertainty over housing and mortgages (refis especially) that isn’t all that surprising. The lack of wage growth also should have been a major factor, especially since the estimates for Real DPI per capita turned negative at almost the same moment.
Yet, for that trouble in sales and consumerism the estimates for retail level holdings of inventory sharply rise after August 2013. That is made all the more curious since that occurred during the worst Christmas shopping season since the Great Recession itself. I have surmised and theorized that QE played a large role in unfortunately setting expectations far too high last year, as the message was reinforced persistently and forcefully that the economy would “undoubtedly” respond to QE3 (with a QE4 for “good measure”). Since the process of ordering inventory and ultimately receiving takes some time, the divergence could be related to that difference between conditions as they were hoped in early 2013 and what they actually came to be later.
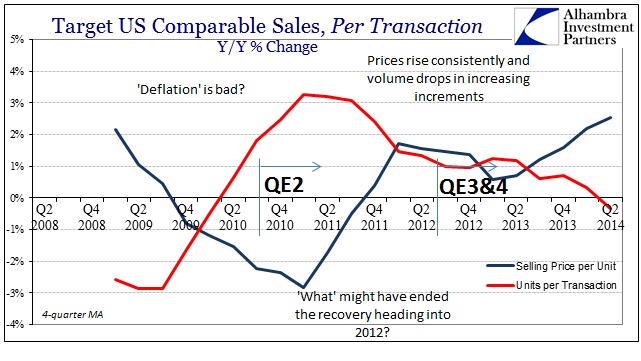
Given, however, additional information in very granular form from Target (and other sources) I have to wonder if price changes are not playing a significant role in addition to retailers listening too much to orthodox economists. The timing is only somewhat “off” with what Target shows of price changes charged to its retail customers, but there was clearly a bump in prices in the same general part of the calendar. Further, the inventory data provided by the Census Bureau while seasonally adjusted is not at all deflated by estimates for price changes (whichever flawed series anyone might choose).
That means the inventory levels that appear to be shooting higher may not be physical inventory at all, it may just be, like GDP, the dollar figure for whatever inventory is held at whatever time period. If there happens to be more price changes than actual and physical accumulation, then the actual impact on the economy is far more muted (but may not be on GDP because of how the BEA chooses a deflator and how that deflator is actually constructed).
When I first looked at Target (and Staples) that theory was bolstered by a very real erosion in gross margins. That would suggest price changes that aren’t being passed along to customers, so we can reasonably assume that those same price changes would apply also to inventory levels (which appeared to again be the case with both Target and Staples – sales levels were zero and negative, respectively, but both companies reported greater inventory levels in dollar terms). More broadly, the BEA’s estimate of corporate profits for the retail segment shows the same trend, and at the same time. So much so, retailer profits in Q1 (the latest figures) were flat with Q1 2013.
That would certainly provide a good explanation, if valid, as to why inventory has appeared to tail off more recently despite all assurances that everything is “rebounding”, at least in dollar terms. And if price changes are continuing to be a problem, as data from Target suggests, as well as the ongoing struggles in retail sales, then the downshift in inventory in physical terms, actual activity, may be understated significantly by the nominal dollar figures.
This would all fit within the paradigm I sketched last week of the economic picture provided by nominal bond yields. GDP may assess greater dollar levels of economic activity, but once more the bond market appears to be highly skeptical. I think the track of inventory adds to that suspicion and provides a much deeper look into economic ailment well beneath the rational expectations surface.
Click here to sign up for our free weekly e-newsletter.
“Wealth preservation and accumulation through thoughtful investing.”
For information on Alhambra Investment Partners’ money management services and global portfolio approach to capital preservation, contact us at: jhudak@alhambrapartners.com

