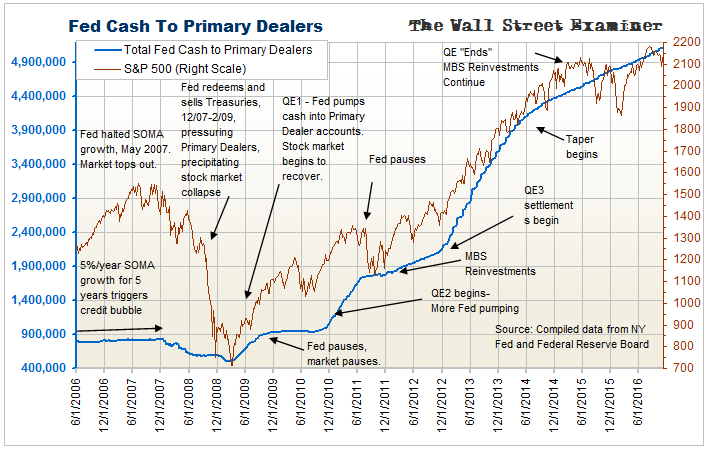
US macro liquidity was flat again in October. Over the past 12 months, the SPX has risen 3%, while the Composite Liquidity Indicator rose by 3.7%. That they are tracking this closely is a bit unusual, but the fact that they continue to trend together over the intermediate and longer term is consistent. Even the slopes of the trends tend to be similar over longer time periods. That tends to support a bid for stocks when prices sell off. But it has been insufficient to push prices materially higher since mid-2014.
The Fed has continued to steadily pump cash to the primary dealers even though QE ended in late 2014. The Fed does forward MBS purchases throughout the month to replace its MBS holdings being paid down. The cash only hits the market when the purchases settle, which is in the third week of each month. When the purchases settle, the Fed deposits the money into dealer accounts. In recent months the Fed’s MBS purchases have ballooned to around $40 billion per month from around $25-30 billion early in the year.

We foresaw that these numbers would increase from earlier this year as a result of the decline in mortgage rates. Lower rates cause an increase in mortgage refinances. That in turn goes to pay down outstanding Fannie and Freddie mortgage backed securities (MBS). The Fed holds some of those. It has committed to replace the paid down paper on its balance sheet. It does so by buying more MBS from the Primary Dealers each month.
30 year mortgage rates are typically indexed to the 10 year Treasury yield plus a fixed margin. Higher rates cause mortgage refinancing to dry up. Therefore, this should be the last month for these larger settlements. Because of the recent surge in 1o year Treasury yields, Fed purchases should drop back again to the $25-30 billion range. The Fed’s MBS holdings would decline less each month and the Fed’s replacement purchases and the cash that flows to the Primary Dealers would decline accordingly.
If bond yields keep rising, refinancing would dry up completely, leaving just new purchase mortgages. They alone tend to run $10-15 billion a month. That level of Fed replacement purchases would be insufficient to stabilize the market. We could be in a bear market in bonds that would destroy the US housing market. It would also increase the US budget deficit, requiring the US Government to sell even more new Treasury debt. That would tend to push yields higher. The stock market would likewise be pressured by the rise in yields.
The requirement for dealers to absorb increasing Treasury supply with less help from the Fed as MBS purchases decline will pressure the market. The problem will get much worse next year when the Trump Administration and Republican Congress pass huge tax cuts. As the Federal budget deficit mushrooms, the Treasury will need to sell a lot more debt each month. Treasury supply could double.
Making matters worse, foreign central banks have been sellers of Treasuries lately. US banks have been buyers, but not enough to offset big increases in Treasury supply and foreign central bank liquidation of their Treasury holdings. This negative trend isn’t likely to reverse any time soon. It has been sufficient to cause a correction and possibly a new bear market in bond prices. It has stopped the stock market rally, although prices have been wildly volatile within the range.
There’s no longer enough liquidity to support more than short term rallies in stocks. Stock market rallies apparently need to self liquidate before they restart. In other words, stocks must be sold, pushing prices down, before there’s enough cash built up to support another wave of buying.
The liquidity basis for the rise in stock prices this week is not clear. It may be short covering, or rotation from bonds to stocks. It’s not due to a broad or sustained increase in total liquidity. Therefore it is probably not sustainable over the intermediate term.
Meanwhile, in the wake of the election, the interest rate on the 4 week T-bill rose to its highest level since July on the day after the election. It is now at the top of a range established shortly after the Fed raised the Fed Funds target last December. A breakout here would bring increased pressure to bear on both stocks and bonds.
This post is excerpted from the Wall Street Examiner Pro Trader Macro Liquidity report.
Lee Adler first reported in 2002 that Fed actions were driving US stock prices. He has tracked and reported on that relationship for his subscribers ever since. Try Lee’s groundbreaking reports on the Fed and the forces that drive Macro Liquidity for 3 months risk free, with a full money back guarantee.


