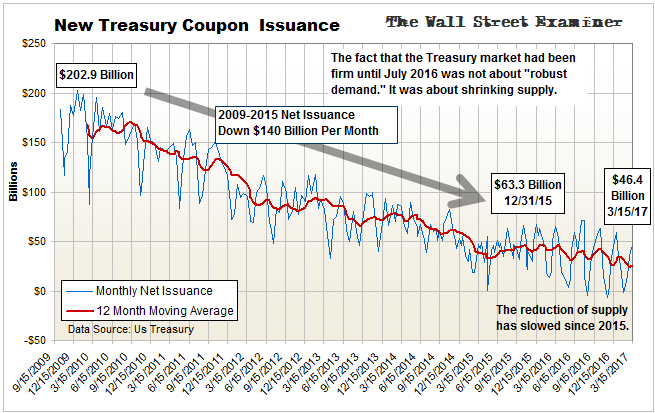
The Treasury issued $26 billion in net new notes and bonds during February. That was $55 billion less than net new supply issued in January.
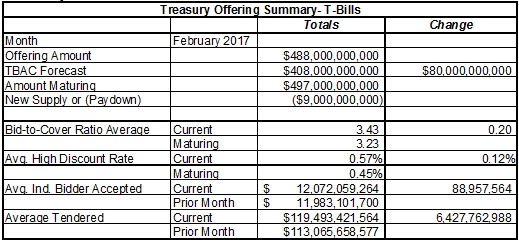
The new coupon supply was partly offset by the paydown of $9 billion in T-bills during the month. The result was net new supply of $16 billion. That’s much less than February 2016 when the Treasury issued $127 billion in new supply. That’s a far more typical February number, when new supply usually is between $100-$200 billion. The Treasury needs a lot of cash in February because that’s when it sends out most tax refunds.
The Treasury was able to borrow much less this year thanks to the hoard of cash it built up for its “rainy day fund” recommended by the TBAC. The reduction in coupon supply kept Treasury note and bond yields from rising.
A better name for the “rainy day fund” might be the Debt Ceiling Doomsday Fund. The debt ceiling will be reimposed at the then current debt level on March 15. Instead of husbanding these resources to push doomsday out into the future a few months, Commandant Trump decided to spread a little largesse around among his friends, most of whom are bond and stock holders. He did so by borrowing far less than the usual amounts the government borrows from the market in January and February.
With supply reduced, yields held steady on average in spite of the fact that the total bid per auction fell from the January average. The decline in the total bid resulted in a weaker bid to cover ratio.
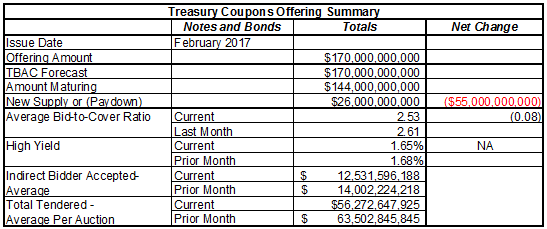
The indirect bid consists of third parties bidding through Primary Dealers. It is somewhat indicative of foreign central bank demand as most of the FCBs typically bid through the dealers. It weakened versus January. January was, in turn, weaker than December. Weak foreign central bank demand has been a notable contributor to the trend of weakness in overall demand.
The trend of weaker demand for Treasuries that has persisted for several years. Bonds were able to rise in value until July 2016 because new supply was falling even faster than demand. The trend of falling supply appeared to end in the middle of 2016. Since then, supply has fallen only slightly while demand has continued to fall at the trend rate.
On the short term paper ledger, the Treasury paid down $9 billion in outstanding bill supply in February. There were $56 billion in bill paydowns in January. The Treasury continued putting cash back into the accounts of the dealers, investors and foreign governments that held the expiring bills. But it did so at a much slower pace in February than in January. In February the Treasury boosted the 4 week bill by $10 billion above the TBAC forecast 3 times. It also issued a gargantuan $50 billion cash management bill on February 9. The CMB is due to expire concurrent with annual corporate income taxes coming in on March 15.
It is interesting that they would schedule the CMB to expire on the date that the debt ceiling is reimposed. Had they put it even a day later, it would have set the ceiling $50 billion higher. In the big picture, it doesn’t matter. It’s just another bit of evidence that in their hubris, the Trumpists want Judgment Day sooner rather than later. They think they hold the winning hand.
When supply is reduced, normally we would expect interest rates to fall. That’s because the Treasury is putting cash back into the accounts of the erstwhile holders of the expiring bills. On the other side of the coin, there’s less paper around to absorb that cash. The holders of the expiring paper then bid more aggressively to replace that paper, pushing rates down.
That did not happen last month. T-bill rates continued to rise. Instead, the extra cash flowed into longer term paper and stocks. Stocks gained as some dealers and investors redeployed the cash into equities.
The fact that short term rates continued to rise indicated that there is an ongoing problem on the demand side. The rise in rates continued this week with Monday’s auctions seeing big rises in 13 and 26 week bill rates from last month’s averages.
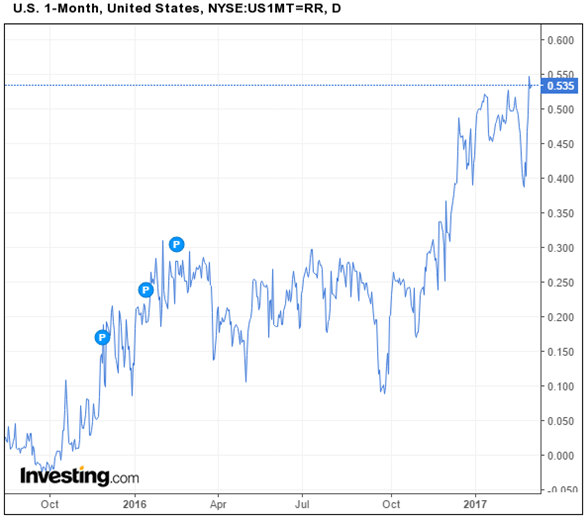
Meanwhile, last week the Federal Reserve Open Mouth Committee more or less ratified that at the March meeting it will ratify the increase in market rates that has already happened. Note that the Fed’s statements all but promising that it would raise rates at this meeting came AFTER the market had already moved.
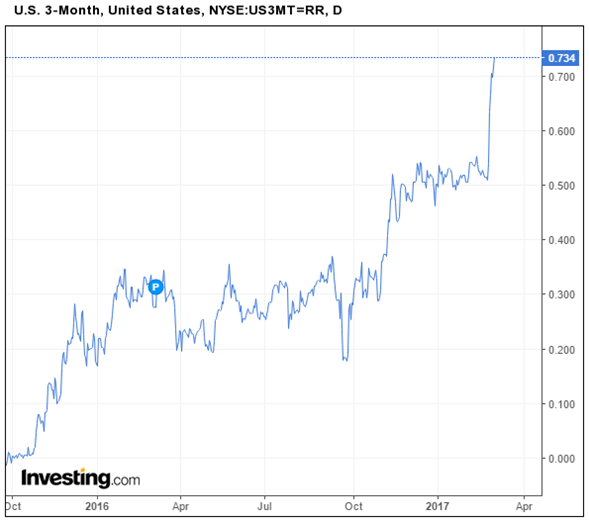
While the ECB and Bank of Japan continue to pump billions into the world financial system, the uptrend in rates is evidence of the money market tightening on its own. The European banking system continues to exhibit signs of stress and money destruction. I cover that in detail in my monthly updates on the European banking system data. It didn’t look good in January. Many European nation’s banking systems continue to shrink. There’s no reason to expect the February data
Regardless of where it occurs, financial stress spawns actions which keep upward pressure on money markets worldwide. It always shows up in the US market because it is the go to market for worldwide institutions to raise cash when it is desperately needed. If the banks need cash, they can always quickly liquidate their holdings of US Treasury bills. That pushes US rates up.
The Fed just ratifies those changes. It doesn’t lead the market. It follows with its silly pronouncements that it is raising rates. The market is tightening on its own.
This report is derived from Lee Adler’s Wall Street Examiner Pro Trader Monthly Treasury Supply and Demand Report.
Lee first reported in 2002 that Fed actions were driving US stock prices. He has tracked and reported on that relationship for his subscribers ever since. Try Lee’s groundbreaking reports on the Fed and the Monetary forces that drive market trends for 3 months risk free, with a full money back guarantee. Be in the know. Subscribe now, risk free!


