Wall Street media pundits put a great deal of emphasis on the monthly jobs report. They act as if it’s the holy grail for divining the direction of stock prices.
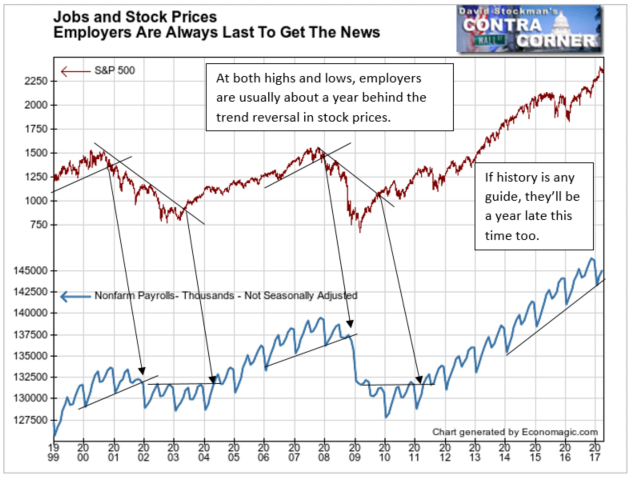
That’s a waste of time. Employers are always the last to get the news. First, when the stock market initially breaks down, they think it’s just a correction and keep adding workers. Then when the stock market’s downside momentum increases, they decide to stop hiring but hold on to the workers they have. That’s less costly than firing them only to have to hire and train a new crop of workers.
Finally, when stocks crash, employers throw in the towel and start cutting their work forces. By then it’s too late. Both the economy and the stock market are usually near the bottom by then.
So the fact that jobs are still increasing tells us absolutely nothing about when the stock market will top out (or has topped out). Nor will it tell us anything about whether the economic expansion has ended. Retail sales are a far more timely indicator for that. But today our focus will be on whatever factoids we might glean from the employment data.

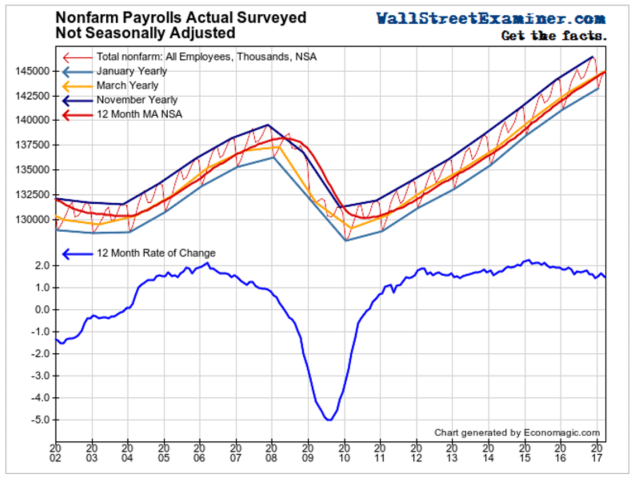
As usual, we’ll look at the numbers on a not seasonally adjusted (NSA) “actual” basis. Even those numbers don’t look real. Seasonal fluctuations notwithstanding, the trend has been moving in a perfectly straight line for 6 years. Is that credible? But it’s all we have, so here goes.
According to the BLS NSA data, 670,000 jobs were added in March. Because we’re looking at NSA data, we need to compare the March gain with March in prior years. In March 2016 the gain was 895,000. Over the 10 years from March 2006 to March 2016, the average gain for March was 740,000. This year’s gain was the worst March since the recovery began in 2010. This tends to confirm the seasonally adjusted headline data that showed a slowdown in growth.
The annual growth rate slowed to 1.5% in March from 1.66% in February. The growth rate has been slowing persistently from a 2.9% rate in February 2015. But the chart still looks like railroad tracks. It’s a testament to the BLS statisticians’ ability to smooth the data… Sort of like IBM’s quarterly EPS.

As strong as this trend looks, there are a couple of flies in the ointment. First is the aforesaid fact that the jobs data is a severely lagging indicator that is useless to traders in timing the market. Second, the headlines don’t tell us whether the gains are in high or low wage jobs. We already know the answer to that one, but here’s a bit of backup.

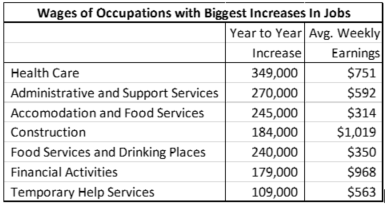
The table at left shows the occupations which had job increases greater than 100,000 over the past 12 months, and the average weekly earnings of production and non-supervisory workers in those fields.
Health care has had the largest increase in the last year. That’s not actually a “job.” It’s a broad field with many kinds of jobs. There are a few highly paid and very highly paid professionals in this field that skew the average wage higher. But many jobs are low wage hospital jobs.
The BLS tells us that here are almost 5.1 million people working in hospitals. But it does not tell us how many of them are orderlies and nurses aides making barely more than minimum wage. I have unfortunately had a lot of experience with hospitals in the past couple of years, and my observation is that there are more orderlies and aides making $20,000 a year than there are nurses and medical technicians making $100,000 a year.
With an average wage of $750 a week a household of 2 hospital workers would make $78,000 a year. My bet would be that the median would be much lower.
The field with the next biggest increase in jobs is Administrative and Support Services, in other words, office workers. They make $592 a week. A 2 income family at that rate would make $61,611 per year, just slightly above the median household income of around $56,000.
Next comes Accommodation and Food Services, with almost as many new jobs in the past year as office work. These workers earn an average of $314 a week. A 2 income household would make $32,675. Who can live on that?
The best chance to make some money is in construction work, with an average wage of $1,019. The 2 income household would break the $100,000 mark. But there’s a problem with that. The current zombie housing bubble has been driven by record low mortgage rates, fed by the Fed. That game is near an end. Likewise, commercial construction has benefited from the biggest commercial real estate bubble in history. That too was driven by ridiculous mortgage rates, thanks to the Fed rigging the market. It drove cap rates to insanely low levels, never before seen in the history of investment real estate. That stimulated massive overbuilding of commercial and multifamily real estate. That con game is also finished.
Workers in financial activities, i.e. bankers, brokers, and insurance hawkers would do almost as well as construction workers. But it’s the same story. The Fed and its central bank cohorts in crime have created the biggest financial bubble in the history of the world. That game is finished. The Fed has made clear that it understands the error of its ways (wink wink), and will soon start to shrink its holdings.
The last occupation on the list of those that gained more than 100,000 jobs in the past year is Temporary Help Services. Those workers made $563 a week on average. That adds up to $58,552 a year for a 2 income household. Even though it’s slightly above the median household income, it’s not enough to actualize the “American Dream.”
This is as good as it gets for American workers. The two high growth fields that earn enough for a decent middle class lifestyle, construction and financial activities, won’t be growing for much longer. Without new jobs in those fields, there’s not much hope for the American middle class, and particularly for blue collar workers, to earn a decent living.
That bodes ill for the trend of business revenues. Corporations can only run the shell game of selling to each other and a few wealthy customers for so long. If businesses don’t grow their markets by both adding workers, and particularly by paying them more, corporate revenues will shrink. And so will the US economy.
Lee first reported in 2002 that Fed actions were driving US stock prices. The US Treasury has also played a role in directly moving markets. Lee has tracked and reported on those relationships for his subscribers for the last 15 years, helping to identify major turning points in the markets in their earliest stages. Try Lee’s groundbreaking reports on the Fed and the Monetary forces that drive market trends for 3 months risk free, with a full money back guarantee. Be in the know. Subscribe now, risk free!


