
Editor Note: Michael Lebowitz of 720 Global Research is an investment consultant, specializing in macroeconomic research, valuations, asset allocation, and risk management. He is a regular contributor to Real Investment Advice.
On June 2, 2016, the Bureau of Labor Statistics (BLS) stunned economic prognosticators and the financial media when it reported that 38,000 new jobs were created in May. The consensus forecast of Wall Street economists was 160,000 new jobs, with estimates ranging from 110,000 to 219,000. Even the most pessimistic forecast turned out grossly optimistic!
At 720 Global we do not forecast economic data, choosing, instead to focus on the bigger macroeconomic picture. That said, we were not surprised by the recent weakness of jobs data. In fact, unlike most forecasters, we do not view the recent employment data as a one-off event but as further proof of a worsening trend in economic activity. In this article, we share a few thoughts that explain why.
Corporate Profitability and Loan Delinquencies
As of the first quarter of 2016, S&P 500 annual earnings have declined for six consecutive quarters and reside at levels last seen in 2013 (data: Standard & Poor’s). Historically, as profitability falters an increasing number of corporate borrowers become delinquent on loans, or worse they default entirely. During such periods corporate executives focus on reducing expenses, which typically translates into reducing headcount. Accordingly, corporate and business loan delinquencies can serve as a barometer of future employment trends.
Commercial and Industrial (C&I) loan delinquency rates, have a strong historical correlation with employment. C&I delinquency rates have risen over the last year and a half, in-line with the decline in corporate profits, to levels last seen four years ago. While the overall delinquency rate is still relatively benign, it is increasing sharply. Another important observation about the delinquency growth rate is that delinquencies tend to trend in one direction for long periods. Note: C&I loans are loans to corporations and businesses and not individuals. Data on these loans are reported on by the Federal Reserve.
The graph below, courtesy of Cyril Castelli of R-Cube, highlights the relationship between the rate of change in C&I delinquencies and employment. The delinquency rates are inverted to better highlight the correlation.
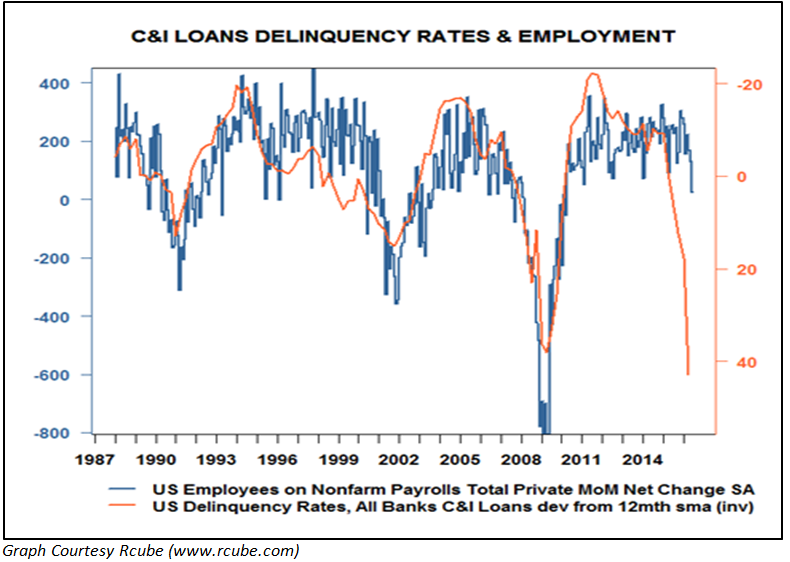
Based on the historical correlation and the sharp growth in C&I loan delinquencies recently, it is conceivable employment drops abruptly over the next 6 months.
BLS Non-Farm Payrolls Data
The graph below charts the three-month moving average of the change in Non-Farm Payrolls against a backdrop of recession periods shaded in light blue.
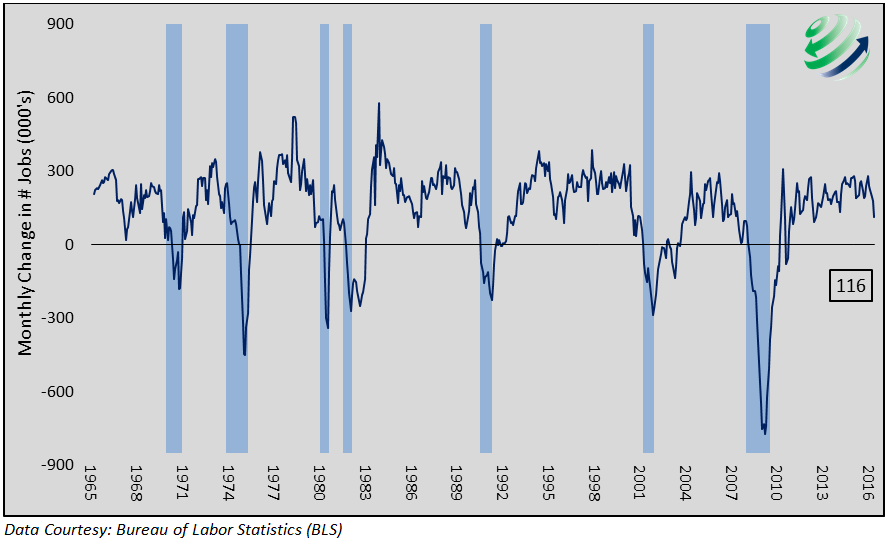
Over the last 50 years, the U.S. was either in recession or just recovering from one every time three-month job growth went negative (below zero on the graph). In fact, on average a recession began when the three-month average of job growth was still well above zero at 104,000. Currently, the three-month average sits at 116,000. If next month’s report shows fewer than 151,000 jobs created, the three-month average will fall below 104,000.
ISM Non-Manufacturing
The Institute for Supply Management (ISM) produces two indices based on a monthly survey of manufacturing and non-manufacturing business leaders. Within the two ISM indices are component indices such as new orders, employment and prices. Most relevant to this discussion is the ISM Non-Manufacturing – Employment index. The graph below plots this index against a backdrop of recession periods.
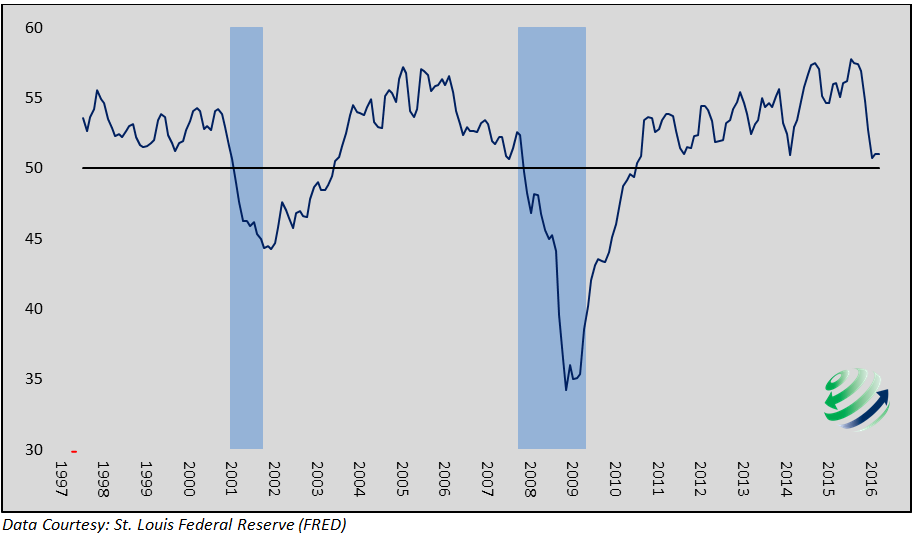
A monthly reading above 50 signifies that a majority of those surveyed believe employment conditions are improving. A reading below 50 denotes the majority think employment conditions are worsening. The most recent reading was 49.7 but the three-month average of the ISM Non-Manufacturing Employment index has yet to break below 50. Historically, each time it has dropped below 50, the U.S. was already in a recession. That said, the three-month average of 51.0 is currently below the three-month average the last two times the U.S. economy entered a recession.
Summary
If C&I loan delinquencies prove, once again, to be a leading signal of employment trends, ensuing job losses will send the BLS employment data and the ISM non-manufacturing employment survey well below levels that, in the past, were recessionary.
Personal consumption represents 70% of GDP, therefore a financially healthy and employed consumer plays an outsized role in swaying economic trends. While the employment picture has generally been improving since the financial crisis/recession of 2008-2009, that improvement is showing signs of faltering. A worsening employment picture has serious implications for GDP growth, increasing concerns we have consistently raised about asset price valuations, which are heavily dependent upon the outlook for economic growth.
Michael Lebowitz, 720 Global Research
RIA Contributing Partner
Follow Michael on Twitter or go to 720global.com for more research and analysis.

