
According to Challenger, Gray & Christmas, layoffs in the US were up 32% in March 2016 over March 2015. Compared to both January and February this year, March was somewhat better but overall for Q1 published layoffs were also 32% more on a year-over-year basis. It wasn’t a very good quarter. Some of that is expected given the death of “transitory” as an effect on oil production which can no longer deny reality. While it is easy to chalk up this potential economic setback to that particular sector, there is much more going on:
“Job cuts have slowed since surging in the first two months of the year, but the pace is still well above that of 2015,” Challenger, Gray & Christmas CEO John Challenger said in a statement. “And, it is not just the energy sector that is seeing heavier job cuts. Layoff announcements have increased significantly in the retail sector and computer sector as well.” [emphasis added]
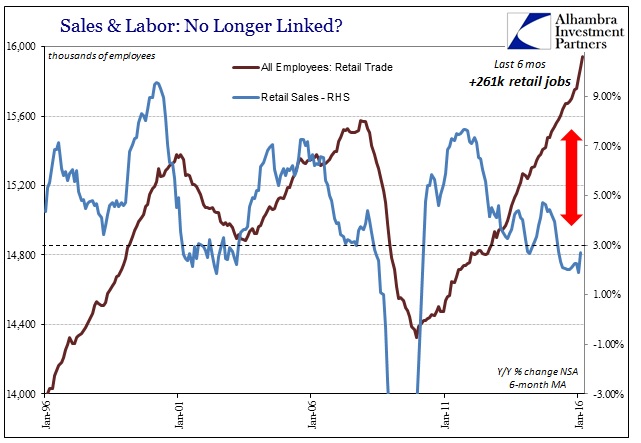
A reduction in employment in retail makes sense given the overall environment, where the Commerce Department’s retail sales estimates remain below 3% (on a 6-month average basis) which has traditionally been the dividing line between retail employment expansion and the dreaded opposite. Other estimates of the retail climate wholeheartedly concur with the expectation for further labor reductions.
The BLS, however, shows just the opposite. In the latest payroll farce, the update for March 2016, employment in the retail industry was estimated to have grown by another astounding 47.7k employees (seasonally adjusted) after absolutely surging by more than 65k in each of the two months prior. In the six months since September, as retail sales have tumbled significantly below that 3% line, the BLS estimates that retail employment is up an enormous 261k jobs. That is a ridiculous 43.5k per month, which is just about three times the rate figured for the period starting August 2003 through August 2005 (15.8k per month) when retail sales were growing by an average 6%.
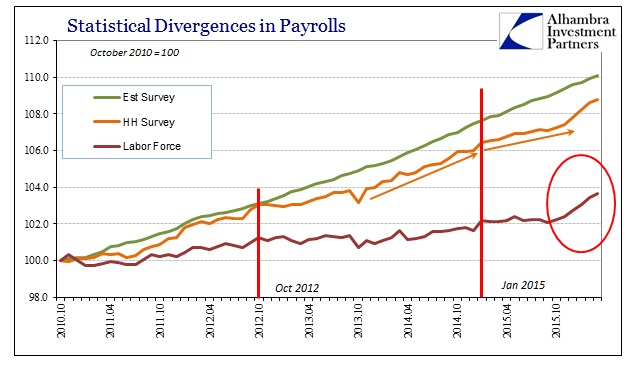
And the rest of the payroll report continues in the same manner, quite perfection on the surface with enormous and growing discrepancies (like the retail industry) underneath. The headline Establishment Survey number was +215k, right in line with estimates if slightly below the recent average. The Household Survey showed +246k while the labor force expanded by just about 400k, leading to the slight rise in the unemployment rate as those officially calculated as looking for work outnumbered somewhat those imputed as having found it.
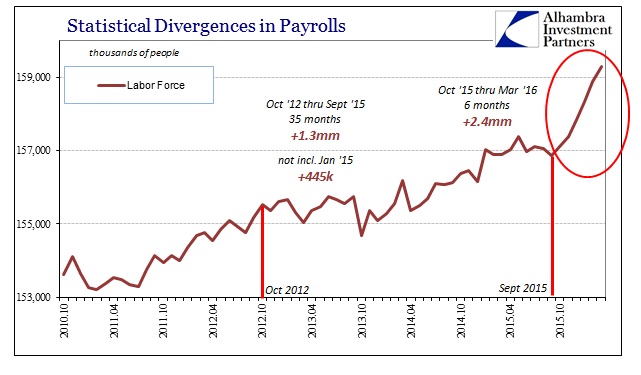
The labor force growth was right on the monthly average of the past six months. That is the problem; such as an expansion is literally out of place for not just this cycle but the past three decades. The BLS estimates that again since September 2015, during some of the worst financial turmoil since 2008, a manufacturing recession and enormous uncertainties about the global economy, the labor force grew by 2.4 million.
The scale of that surge is unprecedented for these sorts of circumstances. The last time the labor force grew by the same amount (in percentage terms; omitting the discontinuity of January 2000) was July 1984. There is absolutely nothing about the economic climate of late 2015 and early 2016 that suggests even the smallest hint of 1984. That was in the midst of really the last actual recovery, where there was no need to go looking for it since it was obvious and evident everywhere – and not just in the statistics.
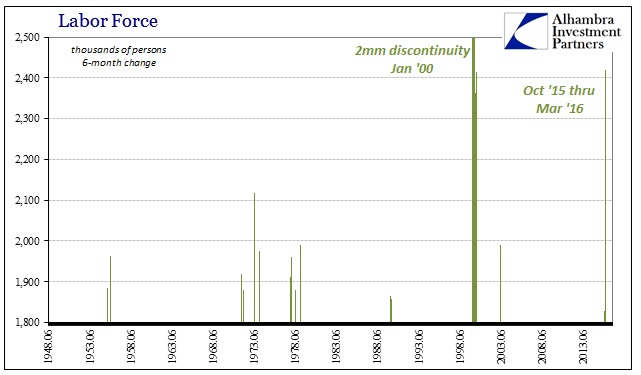
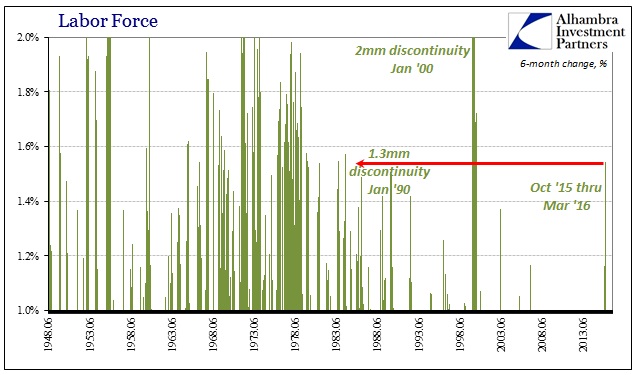
In absolute terms, it is the largest 6-month expansion in the data series going back to 1948 (again, setting aside January 2000). In cyclical terms, since October 2012 when the economy hit the full weight of the 2012 slowdown (which it has never pulled out of it) the labor force had grown only slightly. In the 35 months from that point until September 2015, the labor force is estimated to have increased by just 1.3mm, with more than 900k of those additions due to January 2015 alone (discontinuity?). In the 34 months not counting last January, the labor force was basically flat, having gained only 445k compared to 2.4mm in just the past six months?
Going back to the trough in the official labor force registered in December 2009, from there until September 2015 the labor force added just 3.75mm people and it took 69 months to “achieve” it. GDP was erratic but at least higher during those almost six years and there was no manufacturing recession or oil crash, but now that GDP looks scarcely 1% over these past six months (including the current GDPNow estimate of +0.6% for Q1 with all of its “residual seasonality” included to keep it barely positive) Americans are joining the labor force at an epic rate? It just doesn’t add up. None of the perfect employment report does, which isn’t any change for the past almost two years.
The jobs numbers just don’t suggest anything about anything else in the actual economy; they have been and look like they will continue to be irrelevant. There is, in my view, something very wrong with the statistics, and I think the timing gives it away. Unless someone is to seriously propose that “market turmoil” during these six months destroyed, as an example, something like day trading, forcing millions (2.4, to be specific) of possible day traders to have to suddenly look for work and join the labor force out of nowhere, then the labor force as well as retail sector surges only suggest improper statistical elevations. The same as the past two years or so, only now, like residual seasonality, amplified.

