
The Fed is adding $23 billion to Primary Dealer trading accounts this month as it settles its forward MBS purchases from the last two months May 13-21. But this a drop in the bucket compared to the countless billions of newly printed money flowing into US markets from Europe and Japan. Their central banks keep printing it, and their banks and institutions keep shunting some of it straight to Wall Street. That has continued to feed what, at this point, is probably the greatest asset bubble in the history of the world.
But the Fed is conspiring to call a halt to this orgy by “normalizing” its balance sheet. “Normalizing” is a euphemism for shrinking its assets and draining cash from the US banking system. History tells us not to fight the Fed for good reason. When it decides that it has seen enough froth, it pulls the punchbowl, and when it pulls the punchbowl, we get bear markets.
The Fed will be swimming against the tide initially. The BoJ and ECB have barely begun to even float trial balloons about slowing their QE programs. They will continue to print for many months. But at least they’re talking about it, and the ECB has actually slowed its purchases a bit. In the not to distant future, they’ll still be printing and the Fed will be draining. They’ll cancel each other out. The markets at that point should start to see some fairly violent corrections.
At the same time, money supply won’t shrink yet because 2 of the big 3 central banks will continue to print. Investors and traders, conditioned to buy the dip, will continue to do just that. There should be opportunities for traders to play it both ways. But as day follows night, once a decade or so since central banks discovered that they could rig markets, there will be a hellacious bear market. At that point, dip buyers will have their heads handed to them. Years of gains on the long side will be vaporized seemingly overnight.
So, I agree with David Stockman. For investors, there’s no better time to get out than now. Cash will look mighty good in a few years. Gold might look even better, but that’s a story for another day. Only experienced, active traders are likely to be able to navigate the bigger swings in both directions that lie ahead.
The Composite Liquidity Indicator (CLI)
My proprietary macro liquidity indicator combines 5 different measures of US systemic liquidity. The most important of these is a measure of the cash flowing from the Fed to the Primary Dealers. Other components included a measure of the change in bank deposits not resulting from flows from money market funds, and several measures of commercial bank trading and investment activities. Finally, I include a measure of direct foreign central bank purchases of US securities.
Based on these measures, US macro liquidity has grown slowly over the past year. Meanwhile, stock price inflation has surged, setting up a large divergence suggesting that market positions have become overextended from excessive bullish sentiment.
Over the past 12 months, the Liquidity Composite has risen by 3.8%. Stock prices have inflated by nearly 17% over that time. Since July of last year, liquidity has grown by just 1.6%. Stock prices have risen 11.9% over the same period. Stocks are now most overbought they have been relative to macro liquidity since the market bottomed in 2009. That was a very different environment with the Fed going full blast on QE.
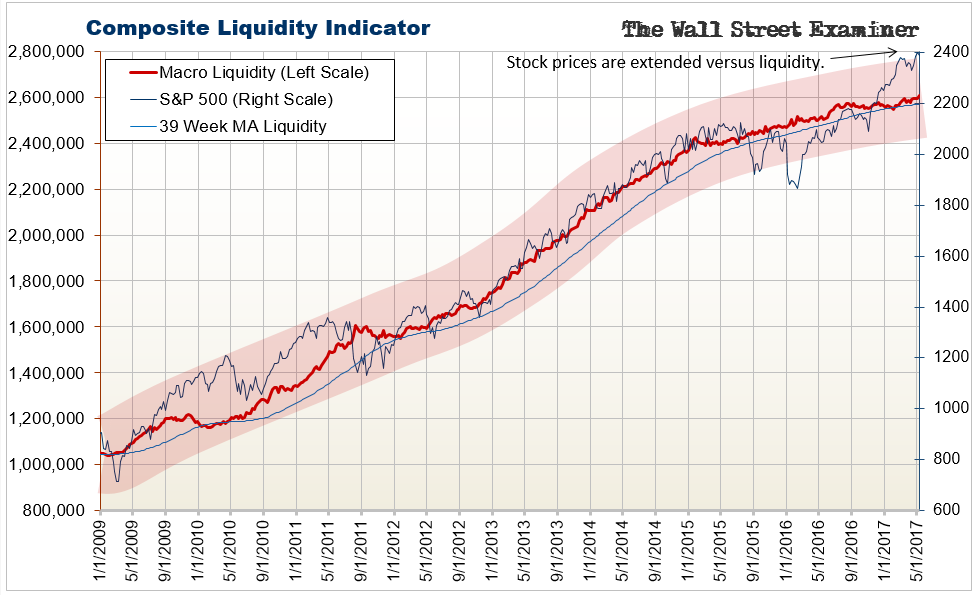
The Fed took its foot off the accelerator at the end of 2014. Now it is talking about not just stopping, but actually siphoning gas from the tank. Liquidity will get even flatter.
Today’s extreme overbought state is the mirror of the oversold extreme reached in February of last year. That led to the first leg up in this 14 month upswing. The current mirror image suggests that a big correction could be dead ahead.
US Commercial Bank Deposits Excluding Money Market Fund Transfers
This indicator measures bank deposit growth. It includes intrinsic growth that comes from bank lending. It also would include inflows from outside the US, as well as money printed by the Fed and lent to the US Treasury. It has strongly correlated with US stock prices. As measured, deposits declined by $133 billion in the month ended May 1, 2017. This was a pullback from the latest new high reached in mid April.
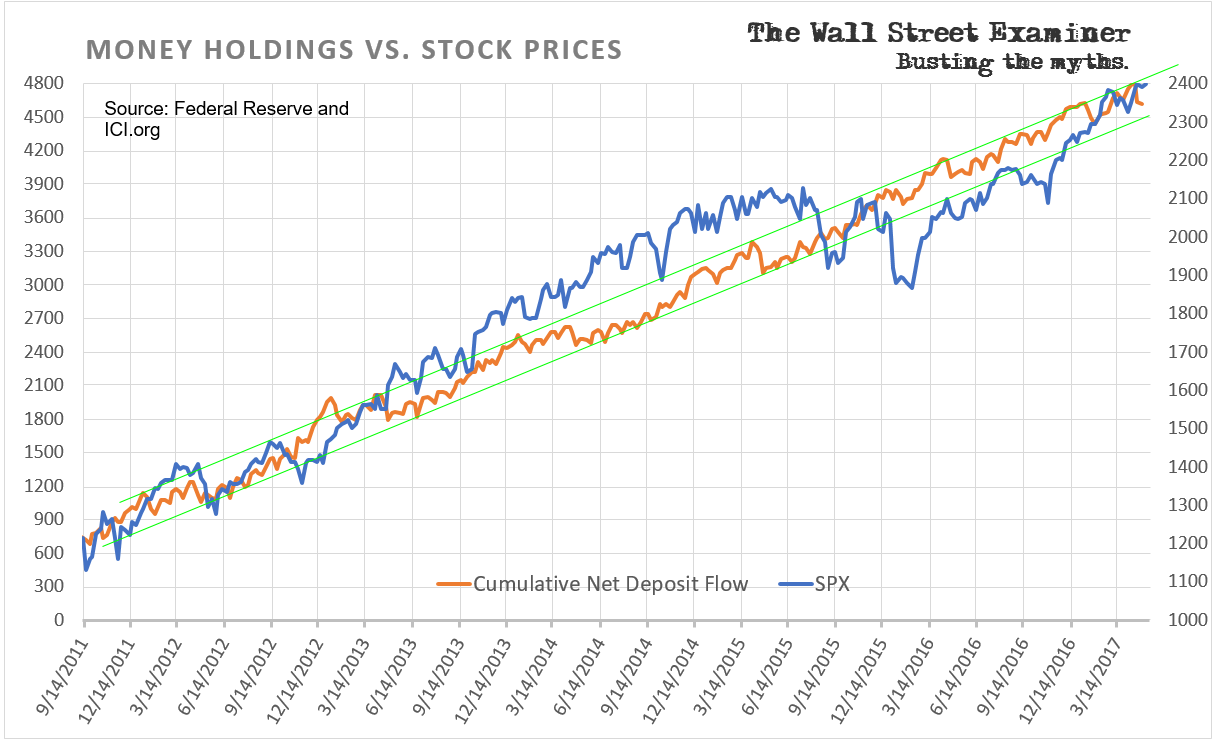
Stocks can, and did, go against this trend for a time on the breaks of August 2015 and January-February 2016. But deposit accounts continued to grow through both periods. The market selloffs did not cause enough capital destruction to reverse the uptrend in deposits.
Borrowers continued to borrow and banks continued to lend. Cash continued to flow into the US from overseas. The market did make lower highs and lower lows over the space of 7 months, which in the old days might have qualified as a bear market. But liquidity kept being created far faster than the markets could destroy it. The recoveries from those two big selloffs reinforced the mentality of buy the dip.
That only makes market conditions even more fraught with peril today, now that the Fed is actively talking about shrinking its assets and removing cash from the system. Add to that that even the BoJ and ECB are beginning to make noises about slowing their money printing. For them “normalization” is still over the horizon, but at least they’re talking about it. The time is coming.
When the Fed starts shrinking its balance sheet, in a vacuum, that would be sufficient to trigger a bear market. The question is whether it will be enough if the ECB and BoJ are still printing. This is a brave new world, so there’s no historical precedent. But if the the Fed’s subtractions are equal to or greater than the BoJ and ECB additions, I think that that will be enough to at least get the ball rolling on the downside. Traders can continue to trade, but investors should probably sell now and avoid the rush.
This report is derived from Lee Adler’s Wall Street Examiner Pro Trader Monthly Macro Liquidity Report.
Lee first reported in 2002 that Fed actions were driving US stock prices. The US Treasury has also played a role in directly moving markets. Lee has tracked and reported on those relationships for his subscribers for the last 15 years, helping to identify major turning points in the markets in their earliest stages. Try Lee’s groundbreaking reports on the Fed and the Monetary forces that drive market trends for 3 months risk free, with a full money back guarantee. Be in the know. Subscribe now, risk free!

