
Each week the St. Louis Fed produces what it calls the Financial Market Stress Index. It issues a press release updating the index. This week it read like this.
Financial market stress fell slightly over the previous week, according to the St. Louis Fed Financial Stress Index (STLFSI). For the week ending April 3, 2015, the STLFSI measured -1.072, down from the previous week’s revised value of -1.068. This is the third consecutive weekly decline.
It explains:
The St. Louis Fed Financial Stress Index (STLFSI)
The STLFSI measures the degree of financial stress in the markets and is constructed from 18 weekly data series: seven interest rate series, six yield spreads and five other indicators. Each of these variables captures some aspect of financial stress. Accordingly, as the level of financial stress in the economy changes, the data series are likely to move together.
How to interpret the index
The average value of the index, which begins in late 1993, is designed to be zero. Thus, zero is viewed as representing normal financial market conditions. Values below zero suggest below-average financial market stress, while values above zero suggest above-average financial market stress.
And their chart.
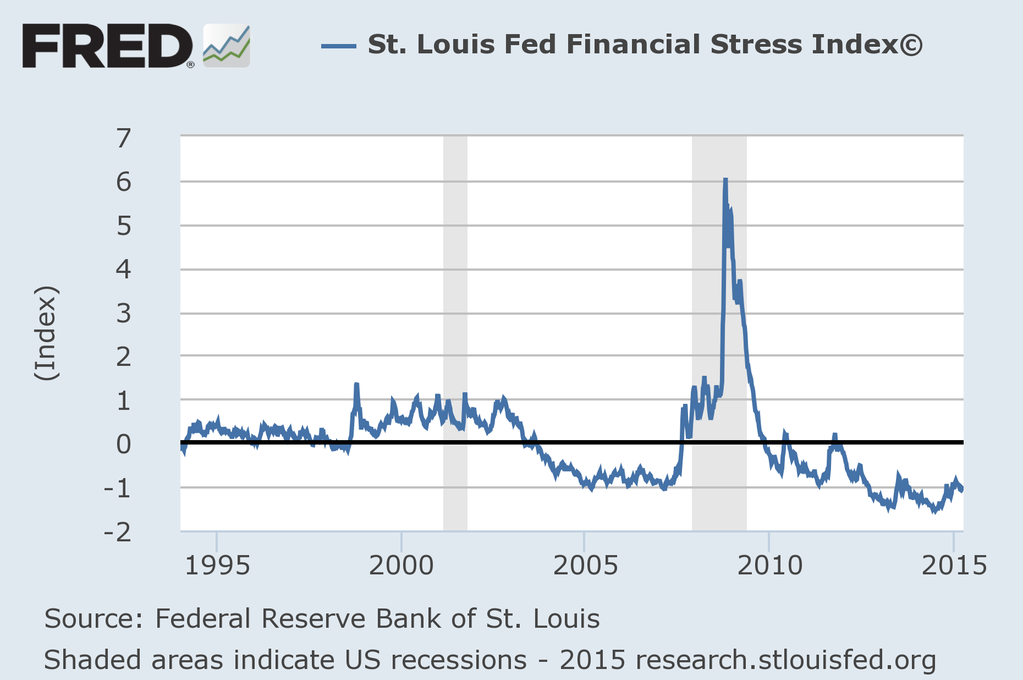
Low stress. Ho hum, right?
Not so fast! Because, you see, they’re doing it backward.
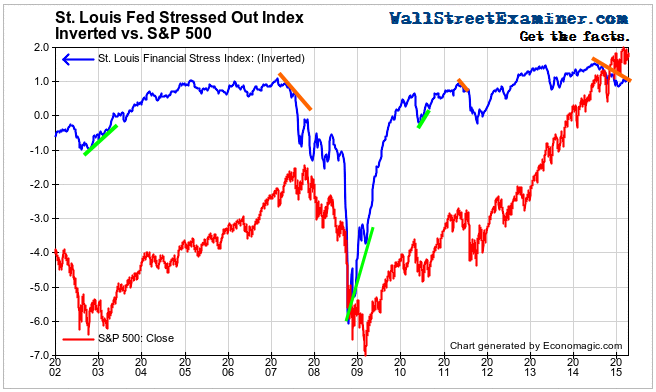
Technical analysts and market chartists call that orange line since the middle of last year a negative divergence. Last time there was one lasting as long as this was in 2007. Apparently it works well at bottoms too, with months long positive divergences developing ahead of stock market turns.
Useful? I’ll let you be the judge.

