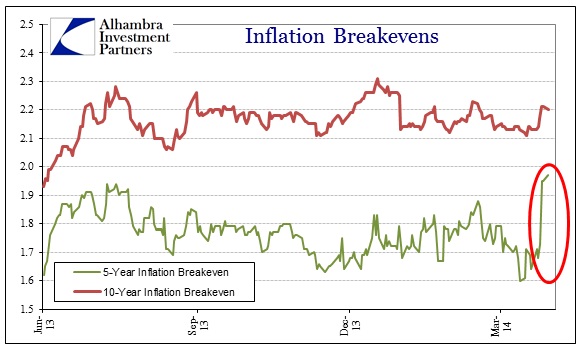
Someone was apparently in need of 5-year TIPS late last week, as the yield dropped 14 bps on Thursday (from -0.06% to -0.20%) ahead of the holiday weekend. You might assign such a move to illiquid markets ahead of Easter, but the yield actually fell another 3 bps on Monday. Strangely enough, there was no reciprocal move in either the 5-year treasury or the 10-year TIPS. It is rather curious and conspicuous.
While the move has left the 5-year inflation breakeven estimate at the upper end of the “stasis” range evident since the bottom of the credit selloff on June 24, the drama of the move becomes clearer once I narrow the context to just that period.
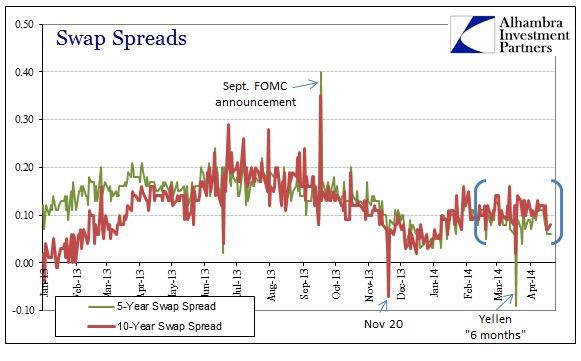
If there was some trend emerging in either inflation expectations or policy expectations you would expect follow-through somewhere else, particularly swaps. While swap spreads have indeed compressed a few basis points in the past week, it is nothing out of the ordinary that we haven’t seen a few times in just the past few months.
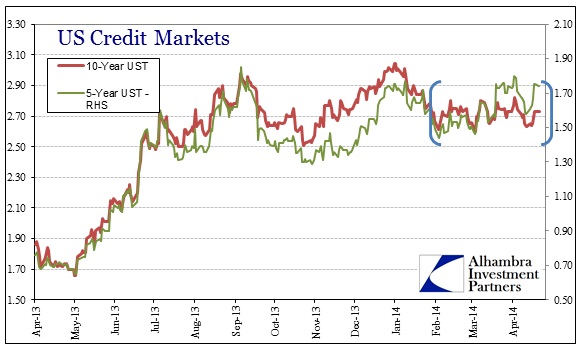
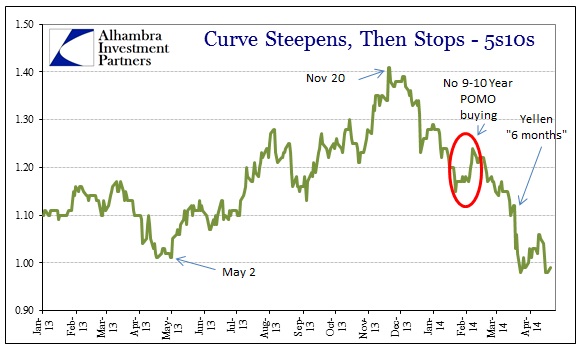
As I have noted on several occasions, the eurodollar market is likewise unusually calm and quiescent – therefore little help in discerning relevance, significance or cause. About the only stirring in the broader credit complex is again surrounding the 5-year maturity. The treasury curve continues to flatten almost exclusively on 5-year selling, though it seems to have reached a resistance point just under 1% (5s10s).
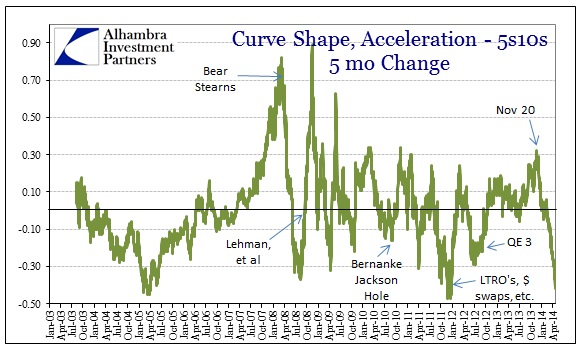
Where the 10-year UST continues within its range, recently bouncing up off 2.60%, the 5-year has exhibited both more volatility and a selling bias. The speed at which the curve has collapsed got my attention, with good reason provided by a wider perspective.
There is a reason this kind of move in the curve is called a “bear flattening” as it is usually associated with negative events. Since the steepest point on November 20, a day that continues to stand out, the last five months have seen the quickest flattening pace in more than a decade (matched only by the dollar dysfunction of the summer/autumn of 2011 and Greenpan’s belated attempt at self-control in 2005). Both of those periods are associated with “tightening.”
That is what makes the move in 5-year TIPS so very eccentric; the typical move in inflation breakevens coincident to such tightening bias is in the opposite direction. Normally I wouldn’t even comment on such a brief change over only several days as this all may turn out to be absolutely nothing, but since the 5-year is the most active place right now, and TIPS aren’t the most vibrant and noteworthy pieces of credit, it seems worth watching.
The last time we saw a one-day jump in 5-year breakevens of this magnitude was the last months of 2008/first months of 2009 (Sept. 19, 2008; Dec. 1&2, 2008; Dec. 16&17 2008; Feb. 9, 2009). Those dates are notable for being associated with either changes in monetary policy or events that changed expectations for upcoming policy positions. That would suggest, tenuously I admit, that perhaps someone is betting that QE taper is coming to an end?
That might explain (partially, at best) why the drastic change in breakevens was limited to the 5-year since that is the nexus between the long end and monetary stance – up to 5 years is where any monetary policy changes will have the maximum effect; further down the curve direct policy intrusion is far less definable or tangible apart from actual POMO buying.
This brings up the possibility of POMO intrusion itself. I have already observed the obvious change in POMO targets around November 20; given that episode of what can only be described as intentional steering of the yield curve shape, it opens the door to at least the possibility of other such opportunities. The Fed already purchases TIPS as part of its weekly POMO schedule, though it is typically left to the outer years (for whatever reason). The Open Market Desk has not bought any TIPS near the 5-year range in quite some time (and currently only holds $213 million of 912828UX6 which is due on 4-15-18). You can at least see why that might be plausible given the FOMC’s interest in fostering inflation expectations in the face of obvious failure to do so to this point..
Unfortunately, the weekly POMO figures have not yet been updated for the current week (current release is up to April 16) so we won’t know for a few days if my Open Market conjecture is anything more than reasoned speculation.
In other words, I don’t really have a good explanation for this, nor even a solid theory. If it was a change in the “market’s” expectation surrounding QE or monetary policy I would expect something similar and conforming in the swaps market. If it was the Fed jumping on TIPS through POMO, I would also expect some kind of additional and concurrent expositions. With nothing obvious and forthcoming it is left to both the imagination and for future reference. In either case, I thought it worth mentioning since nothing like this has occurred in over five years.
Click here to sign up for our free weekly e-newsletter.
“Wealth preservation and accumulation through thoughtful investing.”
For information on Alhambra Investment Partners’ money management services and global portfolio approach to capital preservation, contact us at: jhudak@alhambrapartners.com


