Retail sales in June 2016 were up 3.14% from June 2015. That rate is slightly better than the average from the middle of last year, but not significantly so. The 6-month average continues to straddle the 3% range that traditionally marks recessionary circumstances, about 2% less than the average just before the “rising dollar” economy hit in late 2014. Under actual growth conditions, retail sales should average between 6% and 7% (with the occasional 8% or even 10% month) rather than what we find now of a 3% average (with the occasional 2% or even 0% month).
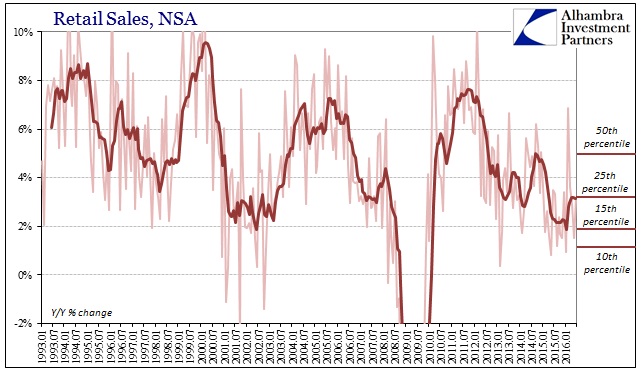
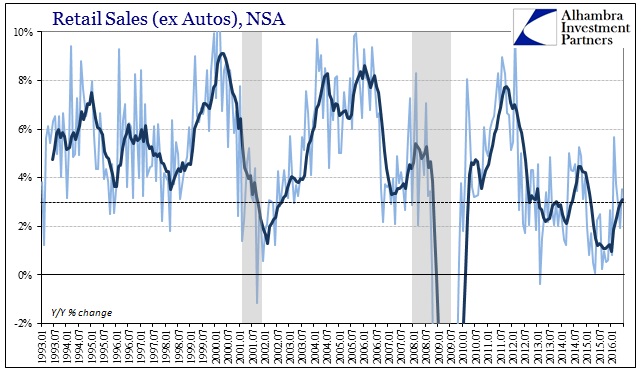
The real problem with retail sales under these terms is not just the low growth rate but its persistence. As with so many other economic accounts, it is the accumulation of questionably weak results and the relevance in terms of time. Measuring overall retail sales on a 2-year basis demonstrates this point very well:
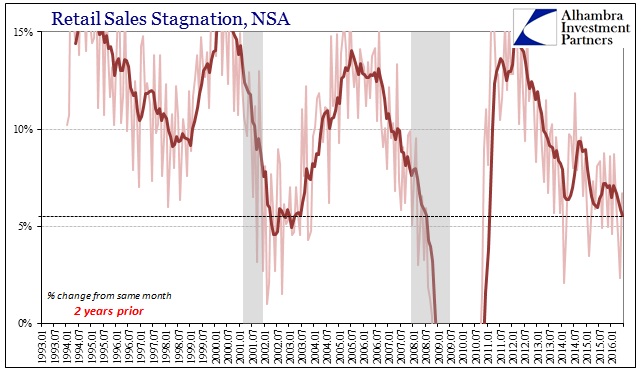
One year of substandard sales growth is a problem; two years is something else. Realizing that alters how we view and analyze consumer behavior, including the rush to online retailing. Since February, nonstore retail sales have jumped, with growth rates of nearly 10% in February, March, and April followed now by 16% in May and another 14% in June. At the same time, however, sales at general merchandise stores have fallen off to nearly flat; sales at department stores, the largest subcategory of general merchandise, have declined sharply especially in the past two months.
In isolation, that would seem to be the natural even beneficial industry shift from “bricks and mortar” to the more efficient and price positive world of virtual commerce. Given the overall stagnation, two years now, is the sudden greater intensity of that transference a macro concern of consumers being forced to price preferences at the expense of physical shopping?
While it’s difficult if not impossible to define exactly the nature of that trend, there are clues in other parts of the retail sales report. Automobile sales have been the one positive in perhaps the whole of the substandard economy especially during the 2012 slowdown period. Even after the initiation of the “rising dollar” economy which further distressed consumer spending, auto sales for the most part remained consistent. That all changed around March 2016, coincident to the surge in nonstore buying.
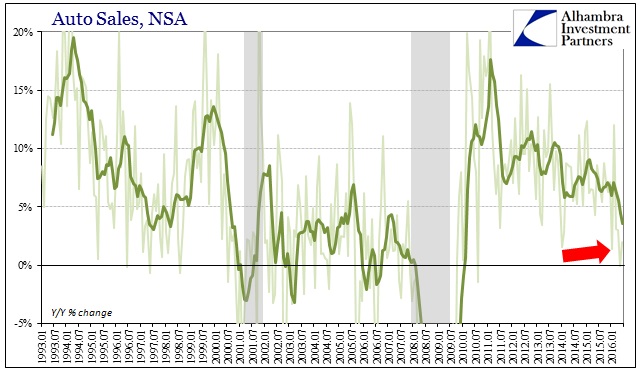
Auto sales in June were up just 2%, following a downward revised sales estimate for May that now shows the first contraction (-0.1%) since July 2010. Sales growth in June was the third worst of the last six years, following the worst, and the sixth and seventh worst the two months before that. The sharply rising auto inventory we find in wholesale terms fits with these numbers, as does the off-trend level of domestic motor vehicle assemblies defined in the industrial production series.
In fact, this continued weak retail environment set against inventory further confirms the contraction throughout industry and manufacturing (here and overseas). Inventories have risen sharply not just on the wholesale level but also the retail level, beginning toward the end of 2014 when sales across-the-board slowed to recession-like levels. For some reason, however, inventories continued to accumulate, which I believe was/is due to the distinct lack of clarity about this economic condition. What I wrote earlier with regard to industrial production applies here, as well:
I believe the answer is, again, the nature of this economic condition as unlike any other. Recession is essentially capitulation; everyone knows something bad is coming so everyone drastically cuts back at the same time leading to self-reinforcing, spiraling effects. In these unprecedented circumstances, however, there truly is no consensus about the intermediate future. There is angst and uncertainty, to be sure, but almost as likely to swing violently to relief and euphoria as hold that way. It could be bad if sales continue to stall into a third year; it could be good if economists and policymakers are to be believed (and somehow they still are). The lack of clarity may be keeping real economic responses to the minimum necessary to achieve a balance between hope and reality.
In the retail segment, that meant as sales declined inventories kept going. The top level of the supply chain, as the bottom levels, seems to accept the slowing sales environment but expecting it only to be temporary – even as it drags on closer to completing a second full year. The fact that production levels are slowly contracting in response confirms at least the forced recognition (imposition of reality against hope) of imbalance between inventory and sales. In other words, it seems as if everyone (except economists) know the economy is in rough shape and unusually weak, just nobody seems to be able to determine exactly what that means beyond small(er) increments of fine-tuning.
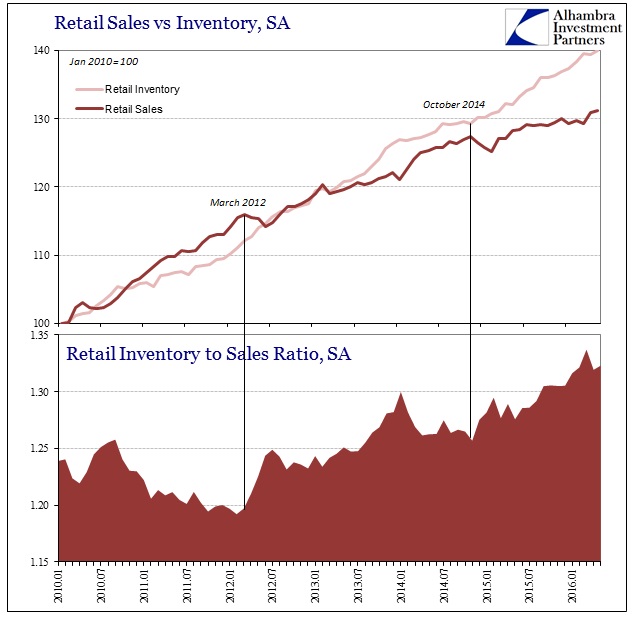
Again, a good part of that confusion is undoubtedly due to how this slowdown has been building slowly, maybe imperceptibly (certainly in mainstream coverage and orthodox “analysis”) for four years. Sales first slowed all the way back in March 2012 but the signal was buried under QE3 euphoria and hope; and then again in October 2014, but that time under conditions of mainstream confidence and extrapolation. As inventory built up in both retail and wholesale from March 2012 to the middle of 2014, production was only slightly adjusted (factory orders slowed). The further reduction of sales against steady growth in inventory finally caused a more pronounced production response in early 2015 (factory orders), becoming more serious toward the end of last year (industrial production).
The shift in autos and even the jump in online sales might propose yet another turn for the worse. Given the prominence of the auto sector as having been practically the only vibrant economic support, the consistent slowdown from sales to inventory to production in motor vehicles is potentially quite significant. There is consistency across production (again, both domestic and overseas), inventory, and sales that shows unequivocally the US economy in very rough shape and that it has been for a suspiciously (eurodollar) long time. Because this is unique to economic history, we don’t really know what another top level weakening might mean.


