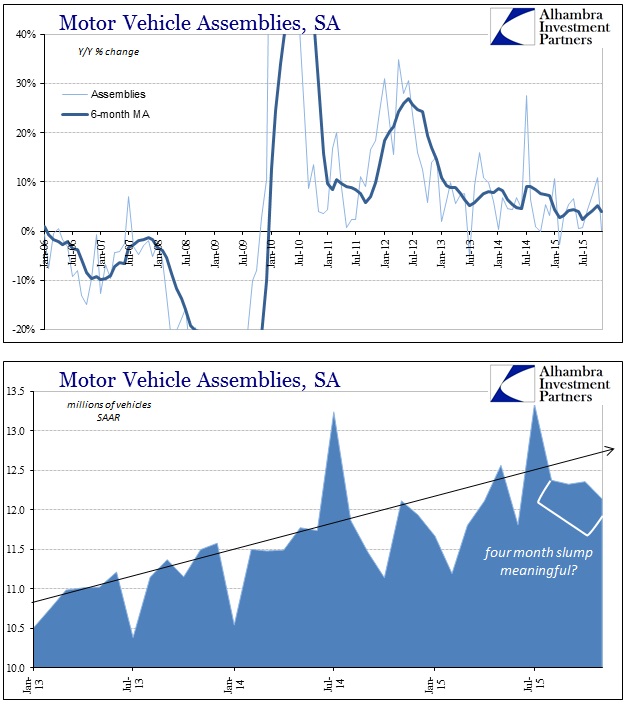
The Fed’s industrial production series also includes estimates on total motor vehicle assemblies. Auto sales in general have been one of the only bright spots in the economy, especially since the 2012 slowdown (even though it has been boosted artificially via credit far, far more than income gains). Given that trend, it is still difficult to assess whether activity in recent months is meaningful. After surging in July, auto activity in terms of industrial production has slumped – now pushed into a fourth month.
Auto production is quite volatile, even where the Fed has attempted to “smooth out” that tendency via its seasonal adjustment factors, so more analysis is needed to establish some confidence about interpretation. Still, at the very least, it raises concerns expressed in the growing (surging) inventory of autos counted in manufacturer’s numbers but stuffed (unsold to end users) on dealer lots and in wholesale limbo.
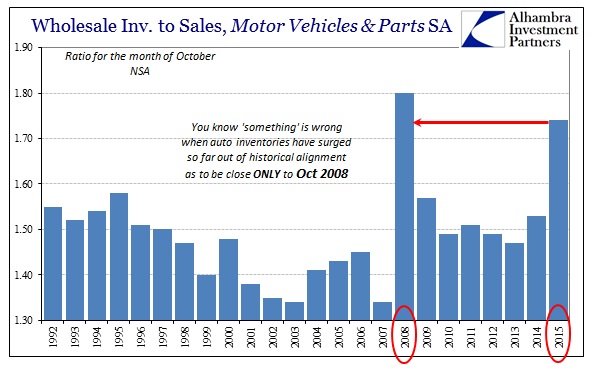
Furthering those concerns, economic reports out of Canada today showed not just broad-based wholesale sales declines but also a four-month slide also in auto sales at that wholesale level. Canada being a primary exporter of autos to the US, the coincidence of further weakening is not likely to be random and yet another negative commentary on the state of US “demand.”
The agency also released October data for wholesale trade, which fell 0.6 per cent to $54.7 billion — its fourth-straight monthly drop.
It said lower trade figures were recorded in four areas that, when combined, represent 64 per cent of all sales.
Sales fell by three per cent to $10.5 billion in the food, beverage and tobacco category — its third decrease in four months. The category of motor vehicle and parts registered a 2.1 per cent drop to $9.5 billion, its fourth-straight tumble. [emphasis added]
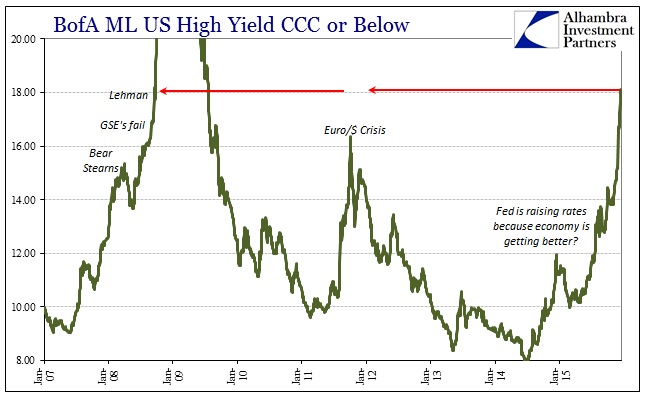
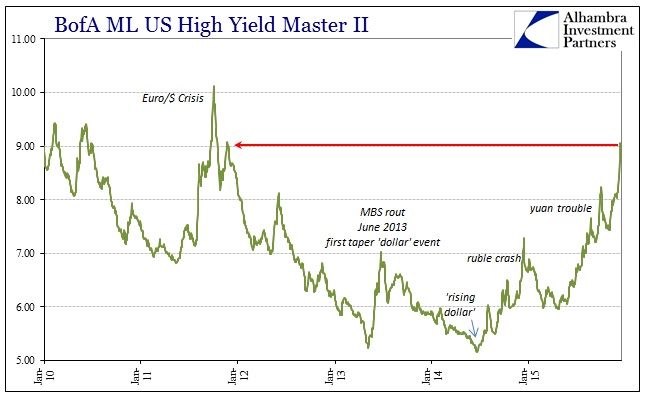
Taken together with the rather steep drop in US industrial production, the risks of a full-blown and perhaps severe recession have undoubtedly grown. Unlike what the FOMC is trying to project via the federal funds rate, a rate that isn’t being fully complemented, either, at this point, visible economic risk is not just rising it is exploding. Nowhere is that more evident than in junk bonds and high yield. The collapse in those markets and tiers has been produced not through actual defaults, which, though slightly rising, remain historically low, but rather through greatly shifting perceptions of defaults that increasingly look likely and in bulk.
That is as much economic commentary as anything that the FOMC might produce. The credit cycle in that respect is not so much monetary policy as a direct component of the foundation of the economy. In other words, if the Fed were truly correct in its economic assessments, that the economy isn’t now overheating but is about to, junk bonds would trade more so with that theme given that it would more than imply continued historically low default rates. There would be no such explosion, as there is now, in the perception of that animating risk factor.
Even so, estimates for default rates next year are conspicuously nowhere near keeping up with price behavior, almost assuredly because the models ratings agencies and selling firms use to project such things depend upon the same economic expectations and modeled forecasts as those which Janet Yellen uses to assure herself there is nothing to fear, economically and financially speaking. So the great disconnect is palpable even here:
So far in the month of December, three companies in the energy sector have combined to add $1.8 billion in default volume to the year-to-date total in institutional leveraged loan defaults. The three defaults will push the default rate even higher than the current 11-month rate of 1.7%.
The data come from the latest report on leveraged loan defaults from Fitch Ratings. The firm also forecasts that the leveraged loan default rate in 2016 will rise to 2.5%, or $24 billion.
The incongruity is obvious; the default rate in just leveraged loans is only to rise to 2.5% (from 1.7% the 11 months so far cataloged of 2015) yet leveraged loan prices, and only those of the most liquid and highly traded names, have sunk in the past week to levels last seen (on the way down) in the days just prior to Lehman Brother’s collapse!
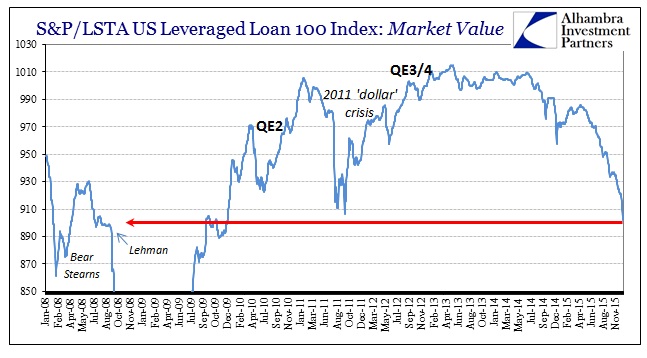
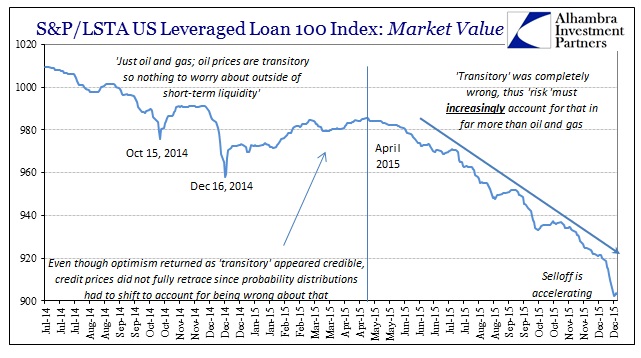
That complements the price behavior from CCC’s which have already bled above the Lehman threshold for comparison. There is some great disconnect where junk bond prices are collapsing so far, with no end in sight, but the mainline estimates for defaults and the economy that is supposed to keep them low has hardly budged. Something is greatly out of line and increasingly it looks like that complacency is hugely misplaced.
Default rate estimates and mainstream commentary about the economy that conditions them continue to mark the favored track but that is nothing like what these junk bond prices are saying – same market, different worlds. The economic risks have heavily shifted and just in the past few months, a recession perception that is gaining a much wider audience. The industrial production figure was, in that respect, a major indication that that is the right insight.
Even the NBER will consider IP as a recession marker on its own if it is blatant enough, which it certainly was, given more mixed signals in other economy-wide indications (such as unstable GDP and the BLS’s unemployment rate and Establishment Survey that never seem to produce spending or even wage growth?).
The NBER does not define a recession in terms of two consecutive quarters of decline in real GDP. Rather, a recession is a significant decline in economic activity spread across the economy, lasting more than a few months, normally visible in real GDP, real income, employment, industrial production, and wholesale-retail sales.
Those last three are already in the recession category, as wholesale sales have persistently contracted this year while retail sales continue to underperform the dot-com recession experience.
The Committee also may consider indicators that do not cover the entire economy, such as real sales and the Federal Reserve’s index of industrial production (IP). The Committee’s use of these indicators in conjunction with the broad measures recognizes the issue of double-counting of sectors included in both those indicators and the broad measures. Still, a well-defined peak or trough in real sales or IP might help to determine the overall peak or trough dates, particularly if the economy-wide indicators are in conflict or do not have well-defined peaks or troughs.
I have no idea whether IP is enough for the NBER to consider a recession already (probably not), nor is it at all clear that such “official” determinations actually matter (they likely don’t). What is important and relevant is that even the NBER, the same economists who didn’t declare the Great Recession until December 1, 2008, long after the full panic and devastation had begun, considers IP a major factor. In other words, as you can plainly see from junk debt, we have been handed a major point of escalation in a startlingly broad fashion (maybe including Canada); that junk bonds are on to something that the “rest” of markets (outside the “dollar”, of course) will not yet consider.
If certain high yield segments, especially leveraged loans, are already priced to the collapse point of 2008, then that suggests something potentially awful about the future course. Industrial production already at -1.2% without any inventory correction yet tells the same worry. It is nowhere near what Janet Yellen had in mind when in her first press conference hinted at March 2015, the six-month point after QE’s end, as the first rate hike. It is, however, the same fears that kept her at bay for three-quarters of the year thereafter. Unfortunately for her, as these prices and data points increasingly survey, it is that progression that should have mattered most rather than blindly depending upon an economic trend that is forced more and more remote, a truly nasty downside gaining increasing visibility instead.


