By Jeffrey P. Snider At Alhambra Partners
If you go to the “fact sheet” for the Russell 2000 index trying to find the standard PE valuation metric, the only one provided by the index keepers is something called “P/E Ex-Neg Earnings.” The current valuation offered is 22.61, which sounds much more reasonable than the latest (April 25) raw PE estimate from the Wall Street Journal: 101.65. The disparity is simply an increase in prices of companies with no actual earnings coupled with an increase in the number of companies featuring that constraint.
Valuations can be tricky and misleading, which is why comparisons are more than helpful. Again according to WSJ calculations, the PE for the Russell 2000 one year ago was only 34.16. Doing some basic, back of the envelope calculations, given that the Russell 2000 was at 1123.50 on April 25, 2014, and 940.28 on April 25, 2013, that would mean earnings have declined from $27 or so to about $11. Over that year, the index was up 19.4%, but that includes the latest stumble that began on March 4.
At the new all-time high on March 4, the Russell had been up nearly 29% since April 25, 2013, at the same time earnings for small cap companies had been declining precipitously. Apparently, cold weather is a warming rationalization for stocks too.
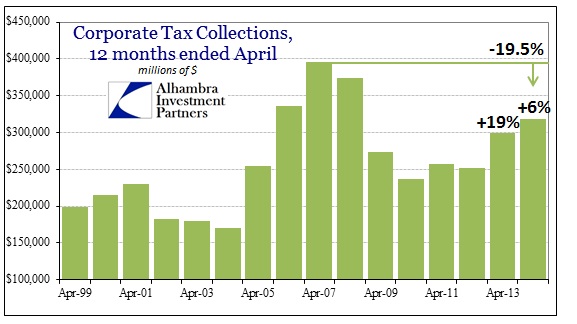
If more and more small companies have started losing money, which the difference between the current PE and that figure Russell itself provides more than suggests, there are more than a few implications here. Right off, this seems to be one possible explanation for the tax data I presented last week.
Small companies have always been more prone to changes in macro conditions than large. But in terms of stock prices, the small caps have outperformed large caps going all the way back to the peak of the dot-com mania. Sensitivity or not, small caps have been cushioned by this rationalization inside what can only fairly be called a bubble.
What that may mean is small companies are finding themselves astride non-weather struggles but stock investors only care about the correlation with large cap stocks. Again, the primary feature of bubbles is not simply valuations or even acceleration, it is the lengths and degrees to which investors will go toward self-delusion via rationalization. There is something very much wrong with the performance of small corporations in the last year, but none of it matters because, as the WSJ “helpfully” calculates, the forward PE for the Russell is an extremely robust and apparently reasonable 18.82.
To go from 101.65 to 18.82 is going to require a hell of a lot of earnings from small companies, so it really better be the weather.
With such a high standard to meet, that is perhaps one reason the small cap correlation has broken down since March 4. Where S&P 500 investors have shown very few concerns over earnings and revenues (though they are both likely going to be about 0% this quarter), small cap investors may have been tinged with some unusual unease.
It is far too early to make any definitive analysis, but the bubble properties are really starting to align. While small caps have only stumbled mildly (the Russell 2000 is down all of 7% from its high), other sectors have seen much more volatility (both up and down).
The most vivid demonstration of momentum and bubble rationalizations being pulled down has been biotech. I still have yet to see a truly comprehensive explanation for the drop (-18.3% since Feb 25), though concerns about government regulation of prices would surely be a blow to earnings projections. And that is largely the point here, that once rationalizations are shattered and reveal the over-optimism maintaining assumptions, the valuations themselves become exposed to more careful analysis.
The biotech index is almost a carbon copy of its own behavior in the late 1990’s. Though the degree to which mania became embedded has clearly lessened, the pattern is itself unmistakable in its similarity. As is the euphoria surrounding participation in these stocks regardless of fundamental conditions.
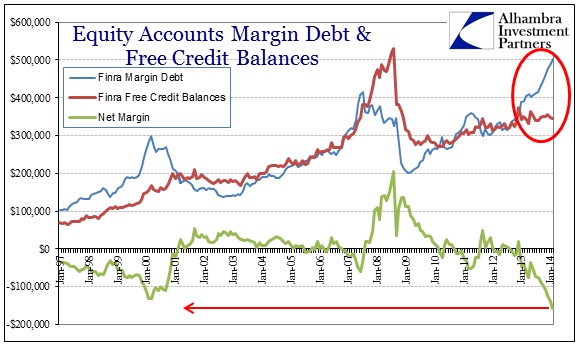
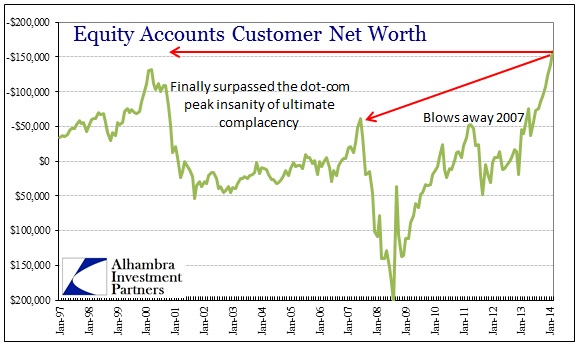
To punctuate these demonstrations of what are certainly abnormal distributions, there is clearly vigor in financing stock purchases in exactly the same manner and now to a far higher degree as the dot-com era.
While we wait the imminent arrival of March margin data, what we see through February is a complimentary statement to that above. It cannot be a good sign for “markets” where the only relevant and useful comparison is to that of the dot-com mania. If there was one clear signal of obsessive (far better fit of actual circumstance than “irrational”) exuberance in 1999 and 2000, it was that companies with no earnings (nor really any prospects for them) were some of the biggest gainers. Then, as now apparently, all they had were overly optimistic projections, endless extrapolations of extravagance into the imaginary.
Perhaps biotech and small cap investors are beginning to penetrate the rationalization bubble, or at least some pieces of reality are. Bubbles go until they don’t.
Click here to sign up for our free weekly e-newsletter.
“Wealth preservation and accumulation through thoughtful investing.”
For information on Alhambra Investment Partners’ money management services and global portfolio approach to capital preservation, contact us at: jhudak@alhambrapartners.com


