By Tommy Stubbington & Georgi Kantchev at The Wall Street Journal
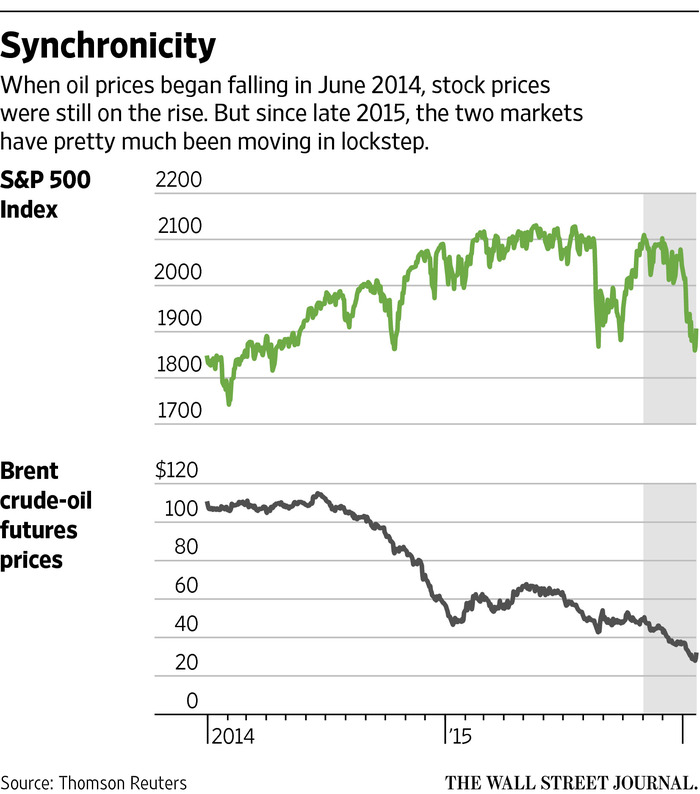
Oil and stock markets have moved in lockstep this year, a rare coupling that highlights fears about global economic growth.
As oil prices tumbled early in 2016, global equities recorded one of their worst-ever starts for a new year. On Monday, oil and stocks were lower again. The S&P 500 index was down 0.7% in midday New York trading, and Brent crude futures, the global benchmark, were down $1.37 a barrel, or 4.3%, to $30.81. That followed a joint rebound on Friday.
The correlation between the price of Brent and the S&P 500 stock index is at levels not seen in the past 26 years. January isn’t over yet, but over the past 20 trading days—an average month—the correlation is 0.97, higher than any calendar month since 1990, according to data from both benchmarks examined by The Wall Street Journal. A correlation of 1 would mean oil and stock prices move by the same proportion in the same direction, while a correlation of minus 1 would mean they move proportionally in opposite directions. Looking at daily returns in the two markets shows a looser correlation, but still a tight relationship by historical standards.
The unusually strong link between the two markets partly reflects a common theme driving both: fears that a slowing Chinese economy could tip the global economy into recession. But as traders and investors in each market look at the other for clues as to how bad things are, they have exacerbated the overall bearish mood.
The recent pattern marks a shift in the dynamics of oil’s 19-month collapse. Traders who long worried that the oil market was suffering from oversupply are now growing concerned that demand may be weakening as well.
“There is a vicious-cycle mentality among investors,” said François Savary, chief investment officer at Prime Partners, a Swiss investment firm managing $2.6 billion of assets. “It has become self-sustaining.”
Even in the oil-rich Middle East, the mood has changed. In Dubai, businessman Ramesh Manglani never used to look at the oil price when investing in equity, despite the influence of energy in the region and its companies.
“Everything’s changed since last year,” Mr. Manglani said, after investing in stocks for nearly a decade. “First thing in the morning we now check oil prices and Asian markets.”
Historically, the correlation between oil and stocks has been tighter during recessions. As the financial crisis spread in 2008, it spiked above 0.8.
That could reflect investors’ tendency to dump all risky assets when times get tough. During the financial crisis, whole swaths of markets moved in unison, as “risk on” and “risk off” trades dominated.
Currently, big swings in oil prices may be forcing some investors to sell stocks simply because they measure risk in their portfolios by looking at volatility across a range of assets. So crude’s recent gyrations are forcing them to trim their holdings of risky assets such as stocks, according to Jonathan Golub, chief equities strategist at RBC Capital Markets.
“As long as oil stays volatile and in the headlines and under pressure, it’s going to be the most important driver” for equity markets, he said.
Stocks aren’t the only asset class showing a tighter relationship with oil during the current turmoil.
Copper prices and corporate bonds have taken similar paths to crude in recent months, driven by fears about global growth. Correlations between oil and credit indexes have moved close to 1 in recent weeks, according to strategists at Citigroup.
Most economists aren’t forecasting a global recession. Still, the growing correlation is another signal coming out of markets that growth could slow rapidly.
“Oil and stocks are being correlated by a single issue, which is fear of slipping global growth,” said Rob Haworth, senior investment strategist at U.S. Bank Wealth Management, which oversees $128 billion in assets.
Until last summer, most stock markets climbed even as oil slumped. The prevailing view was crude’s decline mainly reflected a glut in its supply, as producers from Texas to Saudi Arabia flooded the market. But a raft of weak Chinese economic data around August shifted focus to demand. The world’s No. 2 economy consumes about 12% of the world’s oil, second only to the U.S.
China’s thirst for oil has long been the main source of global demand growth. But this year that growth is expected to nearly halve, according to the International Energy Agency, a top energy monitor.
An oil slump should be a good thing for a big chunk of the stock market, many analysts say. Cheaper energy prices are often compared with a tax cut, likely to boost consumer spending as people have more money in their pockets.
Yet a variety of data, including last week’s poor U.S. retail-sales figures, seem to be suggesting that weaker oil’s expected boost to consumer spending hasn’t shown up.
Even sectors expected to benefit from cheaper oil and fuel have made a dismal start to 2016. For one, the S&P 500 airline sector is down more than 9% so far this year.
Brent crude was down 14% during 2016 as of Friday. That rout is hurting oil-dependent nations from the Middle East to Central Asia, whose sovereign-wealth funds are huge holders of global stocks.
J.P. Morgan estimates those funds could sell $75 billion of stocks this year to prop up their countries’ budgets.
“On average, cheaper oil should be a good thing for the economy,” said Valentijn van Nieuwenhuijzen, head of multiasset strategy at Dutch asset manager NN Investment Partners.
“But in this type of market, it isn’t about the average, it is the fear of unknown,” he said.
Source: Oil, Stocks at Tightest Correlation in 26 Years – The Wall Street Journal


