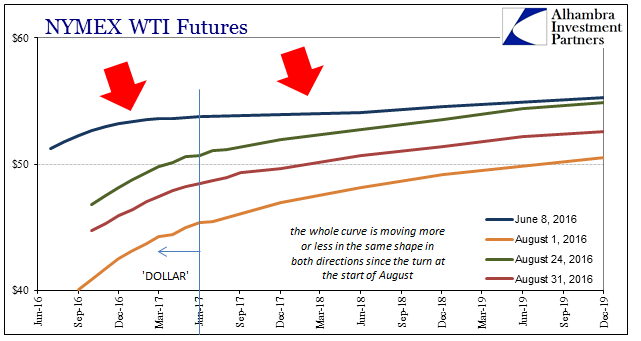
The most remarkable aspect of the WTI crude oil futures curve this month has been its amazing ability to maintain its shape no matter which direction or by how much. Previously, as “dollar” pressures either built or ebbed, the futures curve would either steepen at the front (liquidation pressure) or flatten toward more normal backwardation (easing of the “dollar” difficulties). That was the case since June 8 when the WTI curve was at its flattest in well over a year; but as funding pressures built primarily, I believe, via Japan (increasingly negative and record negative cross currency basis swaps) the curve morphed from nearly flat to once more highly angular contango in the tell-tale sign of the “dollar.”
In short, the Japanese end of the Asian “dollar” had become distressingly disruptive through June and July, but much less so once BoJ singled out the “dollar” in its actual policy changes. Thus, from around June 8 until about August 2, the Japanese-connected “dollar” pressure was increasingly acute and globally disruptive (stock markets obviously notwithstanding because of their own liquidity supply and buying interests, largely myths about what central banks can’t do). Since August 2, much less so; leaving oil once again as a function of “dollars” this time in relatively better shape. [emphasis in original]
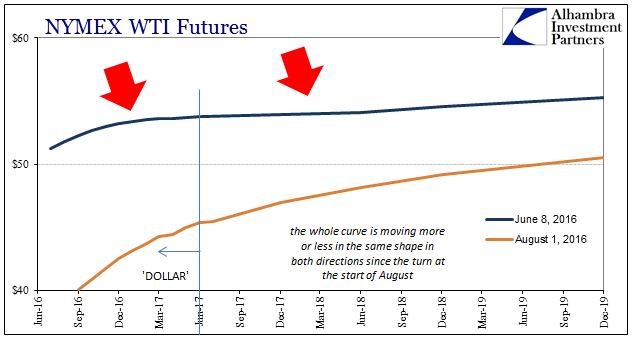
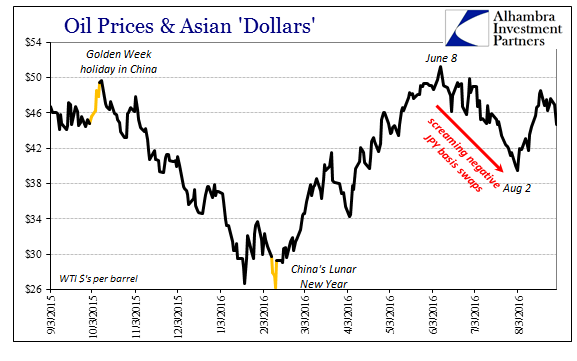
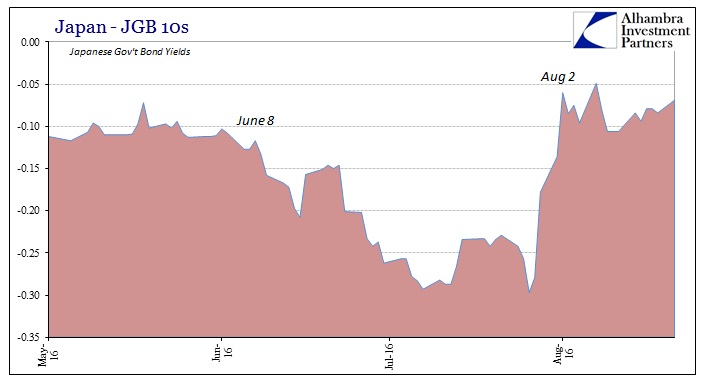
Since August 2, however, though oil prices have risen and often sharply so, the futures curve has held its contango. There are seasonal considerations to factor, of course, but in the raw financial sense this somewhat unusual stubbornness is perhaps indicative of “dollars” beyond solely Japanese connection or influence. It is, after all, a dizzyingly complex set of funding arrangements where the alleviation of one primary effect simply leaves the complex enthralled by the next set.
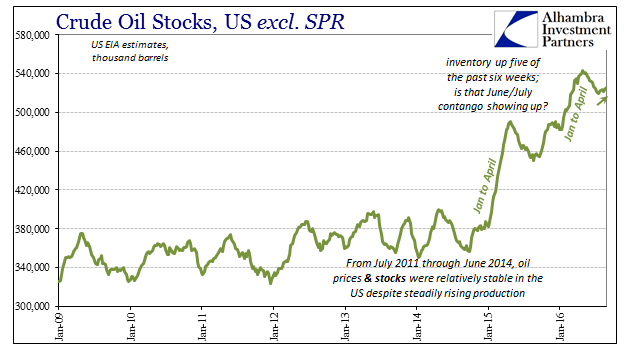
Whatever may be the case with regard to the futures curve shape, it does appear to be having its usual, bearish impact. Crude inventories have started to rise again as expected. Though the total gain is still modest, only 6.4 million barrels so far, the trend seems to be at least steady in this direction, up five of the past six weeks.
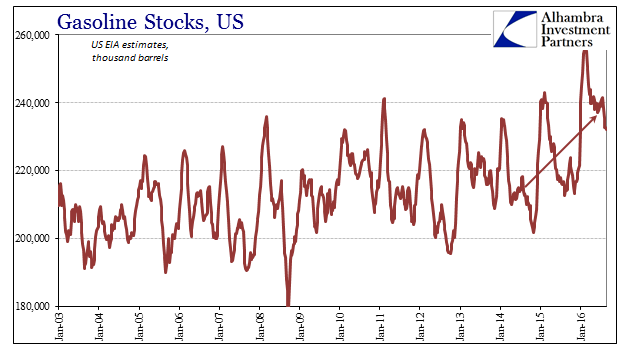
In fundamental terms, gasoline remains the most visible concern. Markets may have become somewhat numb with respect to overall oil inventory, but gasoline is more directly related to pure economic factors especially demand. After adding a little through most of the spring and early summer, contrary to established seasonal trends, gasoline inventories finally drew down at the end of July. But that decline in gasoline stocks only lasted three weeks. Inventories are steady again the past two.
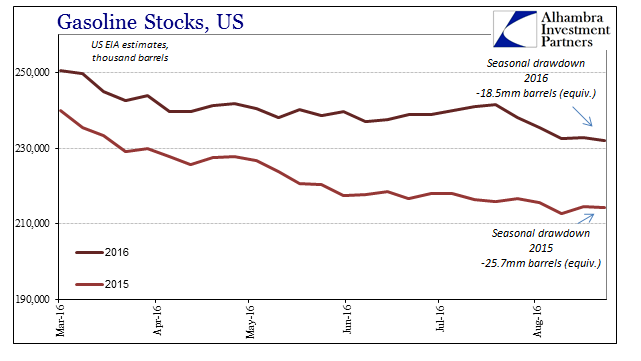
That means the pace of inventory distribution is far below last year with gasoline stocks already that much higher due to the far more than temporary energy problems of the “rising dollar.” Such would indicate not just a weaker demand environment but one that is continuously weakening even this year as compared to last; that wasn’t supposed to happen as 2016 was claimed to be the year by which we would all forget the huge disappointments of 2015.
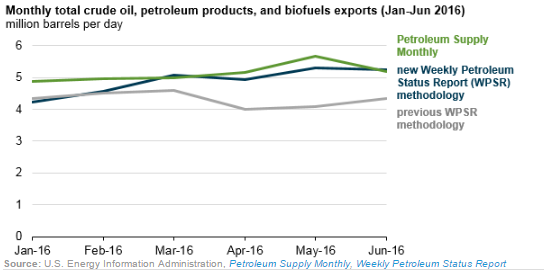
Yet, here we are again with rising inventory, unnatural contango, and a tremendous amount of gasoline that the US economy doesn’t seem to want even at a “sale” price. That isn’t the end of the energy sector bad news for the US economy, however, as the US EIA revised its consumption statistics. By switching to more realtime estimates derived from customs receipts information provided by the US Customs and Border Protection Agency, the EIA found that it had previously understated US exports of petroleum and products. While a very good use of idle crude or distillates sitting in LA or OK, that has the effect of recalculating and then revising prior estimates for domestic demand.
Over the first six months of 2016, EIA weekly estimates underestimated total crude oil, petroleum, and biofuel exports by an average of 16%, compared with final data published in the PSM. This underestimation of exports led to the overestimation of total consumption.
Since exports are a subtraction to arrive at consumption, underestimating exports to such a huge degree means conversely the EIA was overstating domestic consumption (oil and energy products were being used, just overseas rather than here) by more than 1 million barrels per day through most of the spring.
In other words, nothing terribly surprising in oil unless you are expecting dramatic improvement for the US economy through something like a “full employment” liftoff. Instead, viewing oil as a primary intersection between finance and economy, the “rising dollar” part of the eurodollar decay unsurprisingly remains as an ongoing process – not a cycle to be moved into and then quickly out of. All the same mechanisms that were shocking economists in late 2014 and early 2015 are still visible here in the summer of 2016. It’s not going to just go away; like oil and gas inventory, it only gets worse a little more each time in these uneven waves.
At least with these revisions to exports and thus demand it likely means the final end of whatever references to the “supply glut” that might still linger. It had become frustratingly common in especially the media to find repeated and emphasized reference to oil prices as specifically a supply problem alone. That was, of course, a function of economists predicting nothing but great things for the economy, US and global. Since oil prices crashed it could only mean drastic oversupply, at least so long as remaining faithful to the liftoff scenario. If nothing else, the quite proper banishment of all talk about the “supply glut” is a very real sign of resigned acceptance even among the most hardcore optimists that the “rising dollar” economy was not a one-off aberration and a very real economic pressure on the whole; as if we needed more proof.


