The US Census Bureau released housing starts data late last week. It reported that single-family housing starts in December were at a seasonally adjusted annual rate of 795,000. The report continued that “this is 4.0 percent (±9.2%)* below the revised November figure of 828,000.”
The Bureau thus highlighted the statistical imprecision of the first release for the current month. Furthermore, if you have been reading these Data Dives, you are familiar with the shortcomings in using seasonally adjusted (SA) annualized data. Annualizing seasonally adjusted monthly data merely multiplies the error inherent in the monthly SA number by 12. I expounded on the SA problem most recently in this week’s post on total housing starts.
The single family and multifamily development industries are two very different businesses. The Census Bureau’s monthly housing starts data starts by combining the two and reporting the consolidated number. It may obscure big differences between the two businesses.I talked about the differences in greater depth in the previous post covering multifamily housing starts.
The single family housing data is where the financial media places most of its attention. Rightly so. It’s currently about two thirds of total housing development. In bubble times like the early 2000s, it’s an even bigger part. Its drivers are very different from the multi family business.
90% of the multifamily business consists of rental apartments. Buyers of the properties are not the end users. They are investors who do not occupy the properties. In the single family market virtually all buyers are the end users and occupants of the properties. Supposedly, buyer demand in the multifamily businesses is driven by cold eyed investment decisions. In the single family business the decisions are driven by end user economic wants and needs, and their confidence in the future.
Single family home purchase decisions are often irrational and emotion driven. The level and direction of mortgage interest rates are a huge factor not only in the purchase decision but in developers’ decisions on how much product to supply to the market. That’s where the housing starts data comes in.
The Wall Street Journal dutifully regurgitated the data reported by the Census Bureau. The Journal said that “Single-family housing starts dropped 4% in December…” and that, “Single-family starts were up 9.3% last year…” referring to 2016 as a whole. Both numbers represented the annualized SA data. The Journal report then did an about face and turned cautious as it interpreted the data. It actually seemed to recognize my criticisms of its past reporting by giving the data some critical perspective.
“When you look at single-family [construction] we’re still at recession levels, which is quite remarkable because historically the real-estate cycle leads the business cycle,” said Sam Khater, deputy chief economist at CoreLogic Inc., a housing data firm.
The numbers look particularly bleak when accounting for population growth. The number of single-family and multifamily starts per 1,000 households remains about 38% below the 50-year average, according to Ralph McLaughlin, chief economist at housing website Trulia.
The use of SA data can still obscure what’s actually happening. So we look at the actual not seasonally adjusted data (NSA) to get a clearer, unmanipulated view of the trend.
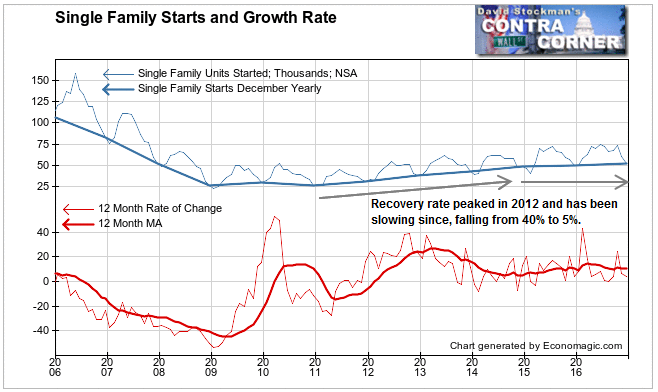
The Census Bureau reported that a total of 52,100 single family units were started in December. That’s 8,700, or 14.3%, less than were started in November. As Decembers go, it was a worse than average performance for the month. Over the past 10 years the November to December drop averaged -10.8%. In December 2015, the decline was 6.7%. Last month’s drop was actually worse than any December since the Great Housing Bubble began to crack in 2006. That can’t be a good sign.
The Census Bureau and mainstream media reported that total single family starts for the year were up 9.3%. That’s close to the actual figure of +9.6%. But it fails to recognize that December 2016’s production was up only 3.8% from December 2015. November was up 6.7% from November 2015. Momentum is slowing.

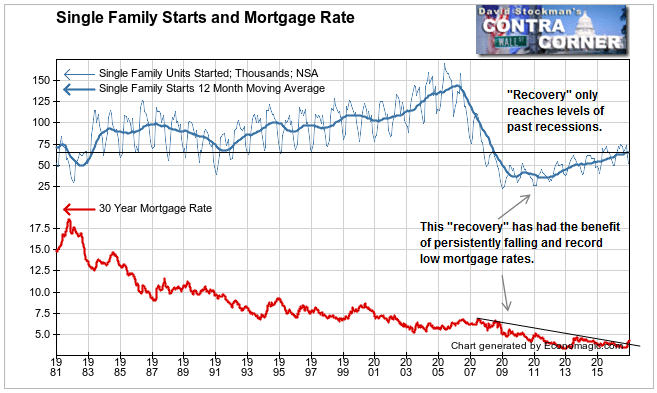
You can see on the above chart how the “recovery” compares with peak bubble levels in 2006. But how does it compare with past recoveries? And what impact has central bank suppression of mortgage rates had?

We are now 7 years after the bottom of the housing crash. There have been 5 years of persistent “recovery.” Yet single family starts currently only exceed the levels reached in the 1982 recession. At that time 30 year mortgage rates hit a high of 18%! Current starts have barely reached the level of the 1991 recession when mortgage rates were between 10% and 8.5%.
Since the recovery began in 2011, mortgage rates have been at record lows between 3% and 5%. The weak recovery has resulted in new single family housing construction becoming only a tiny contribution to US GDP, around 1%.
That’s not a lot of bang for the bucks stolen from American savers, mostly retirees. The Fed’s suppression of interest rates has crushed millions of American savers. It reduced their interest income to virtually nothing. Thus it sharply reduced spending by retirees who now make up around 14% of US population. We have to ask how much the Fed’s financial repression has benefitted the US economy on net given the loss of this spending.
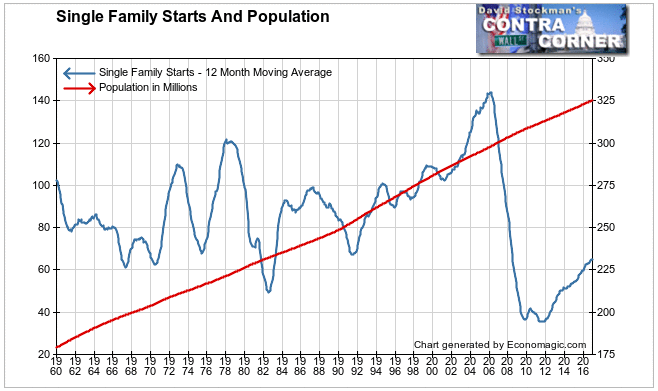
The data on housing starts goes all the way back to 1959. US population has grown by 81% since then. To show just how pathetic the Fed’s efforts have been, the number of single family starts today is roughly 35% less than it was in 1960. A nation that has 81% more people than in 1959 is producing 35% fewer homes for owner occupancy that it did in 1960! That’s in spite of 2 income households increasing from 25% of total households to 60%. It’s in spite of mortgage rates falling for 35 years. It’s in spite of the Fed pushing rates down to record lows for the past 8 years.

For an ever increasing number of “middle class” households, the American dream of home ownership has become a lost hope. The size and slope of the current housing recovery relative to population and relative to past housing rebounds, epitomizes the issue. All of King Donald’s decrees to build walls, erect trade barriers, to stop brown people from entering the US, and to restart 2,300 miles of pipelines when we already have 2.5 million miles of them won’t do a thing to change that.
As interest rates rise the picture will only get bleaker. With an increasing percentage of Americans no longer afford to invest in themselves and their futures, it’s hard to envision a case for “stocks for the long run.” It’s a question of how long those at the top of the pyramid can keep the game going while the base shrivels.
Lee Adler first reported in 2002 that Fed actions were driving US stock prices. He has tracked and reported on that relationship for his subscribers ever since. Try Lee’s groundbreaking reports on the Fed and the Monetary forces that drive market trends for 3 months risk free, with a full money back guarantee. Be in the know. Subscribe now, risk free!


