Yesterday we looked at total housing starts for October. The numbers were very strong. I concluded that within those strong numbers lay the seeds of destruction.
Total housing starts are comprised of single family and multi family units. The total number can be misleading about one of the two markets if one is materially stronger than the other.
These are very different markets. It’s important to look at them as the separate and distinct markets that they are. Single family is normally about 70% of the residential development market. Multifamily is different because the vast majority of multifamily construction is for the rental market, not the ownership market. It makes little sense to combine the figures from the two sectors. One of them can be in a slow or no growth environment and the other can be booming.
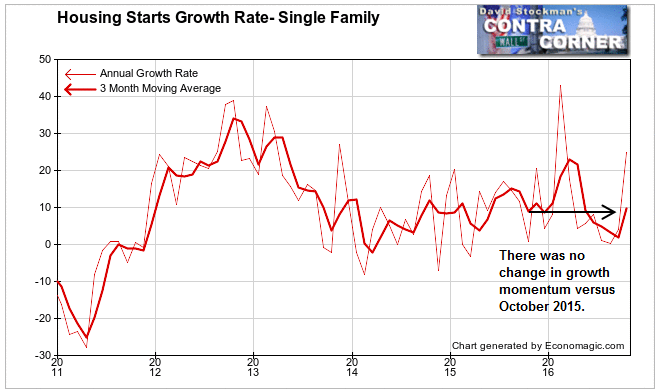
Single family starts were very strong in October. Year to year growth was 24.8%. Month to month was up 8.6%. That was the best October of the past 11 years, since the housing bubble peaked. The reason the year to year comparison was so strong was because last October was peculiarly weak. The current October month to month change was strong partly in a rebound from weakness in August and September. Compared on a 3 month moving average basis, the growth rate was a much less spectacular 10%. This was almost the same as in October of last year.

More importantly there appeared to be a speculative element in this number that should raise a red flag.
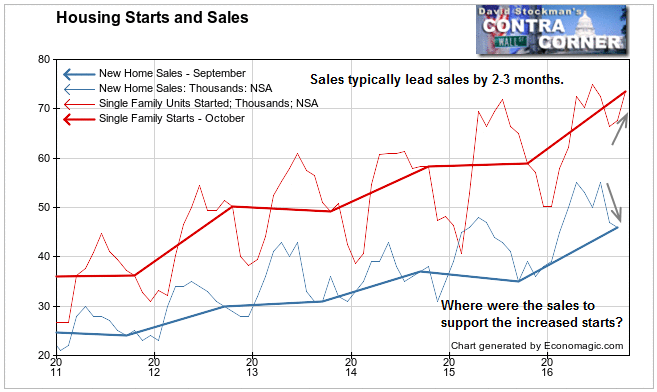
10% is still very strong growth. What’s wrong with that? Typically sales lead starts by 2-3 months, sometimes more. Once sales pick up, builders start to build. Likewise, a few months after sales peak, the number of starts begins to fall off. Since many homes are built by custom builders on land the customer has previously purchased, these don’t show up in the sales data. Therefore starts are always greater than sales. Likewise, when builders want to, they may build more houses than they have orders for. This is called “spec” building, because the builders are building on the basis of speculating that they’ll be able to sell it before or soon after it is complete.
But it doesn’t always work out.

In August and September, sales were weak. But starts rose in September and particularly in October when they usually decline. Where were the sales to support that increase in starts? They certainly weren’t there in August and September. On Wednesday, the Commerce Department will release the October new home sales data. If they don’t surge, it could be a sign of real trouble ahead.
Another factor that I think played a role in the surge in starts this month was the individual custom home market. People owning lots are now rushing to get their houses started and built. They sense that mortgage rates are rising, and that this isn’t just a blip this time. The combination of a construction loan with a subsequent permanent mortgage is complicated. Buyers may not be able to lock a mortgage rate until the house is complete. All of this furious activity pulls demand from the future.
This surge in construction starts is likely to drain the market of new demand for several months. What happens beyond that will depend on mortgage rates. If they continue rising, as I think they will based on the shrinkage of available cash in the world (discussed in my previous report), then the jig is up. This surge in starts will have marked the final blowoff or this housing recovery.
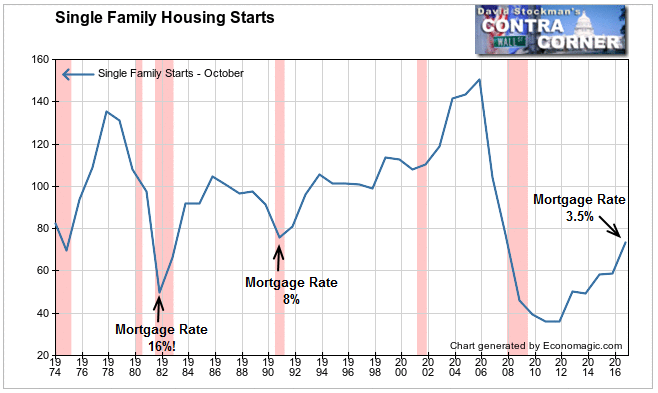
Speaking of “this recovery,” we need to keep things in perspective. The new home construction industry is much smaller today than it was 10 years ago. The growth looks very impressive on the two previous charts. It’s because of where they start—at the bottom of the worst US housing market crash since the Great Depression. The market ran at an annual sales rate of less than 300,000 homes per year in 2011. During 2000-2007, a sales rate of a million homes per year was considered normal.
Wall Street economists and media pundits like to talk about the strength of the housing market contributing to economic growth. They point to charts that begin in 2011. But when we look back decades we get a very different perspective. Starts have only recovered to slightly above the level of 1982 when mortgage rates were 16%! The market still hasn’t recovered to the level reached at the bottom of the 1992 recession. It took mortgage rates of 3.5% to get the market this far. And that rate is now history. 30 year fixed rate mortgages hit 4% today. Based on the 100 basis point increase in the 10 year yield over the past month, rates should already be at 4.5% or more. Rates are lagging bond market yields. That condition can’t last.

As bad as this looks, consider that US population has grown by 27% since 1991, and we’re still producing less houses than in 1991. That was also the bottom of a smaller housing crash. This is after 5 years of recovery.
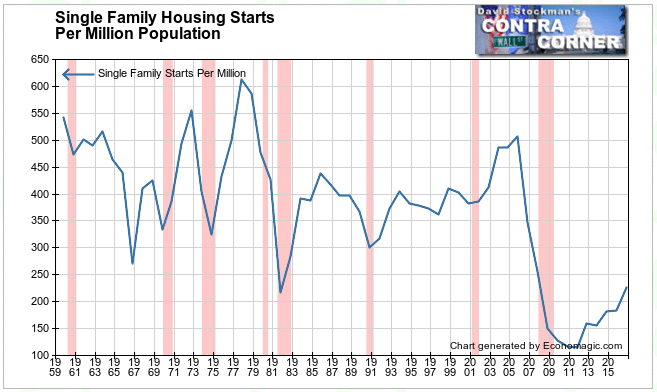
When we adjust starts by population, it looks like this. This chart goes all the way back to 1959, to give you an idea of just how bad the current environment is historically.

Even after more than 4 years of recovery, the current number of starts adjusted for population is still below the level of the bottom of the 1981-82 recession. The implications are that fewer people in America than ever before can afford to buy a new house, and that new single family construction is no longer a significant contributor to the US economy.
In fact, single family construction only comprises 1.3% of GDP. Changes in this category would be barely a rounding error in terms of total GDP. What is important is what this category signals for the economy as a whole, as well as for the stock market. Housing was a leading indicator at the last top. Starts topped out in 2005 and 2006. Prices only began to fall in 2007. Total economic growth didn’t turn negative until months later. It was a chain reaction.
There’s one other thing to note on this chart. Housing has always run in boom-bust cycles. Those cycles tended to last 4-7 years from trough to trough and peak to peak until 1981. About a year after that, the Fed began to hammer interest rates lower in a trend that has now lasted 35 years. With rates steadily declining, the next cycle lasted almost 20 years from trough to trough.
Today the Fed can no longer push rates lower. That constant tailwind is done. There’s no more and it’s about to become a headwind. Without the help of constantly falling mortgage rates, the housing market should now return to a more normal boom bust cycle. It has been 10 years since the last peak. With mortgage rates now rising, this market is long overdue for a top.
The big surge in starts in October may have been a sign of builders rushing to take advantage of the last of the good times before a long winter sets in.
Lee Adler first reported in 2002 that Fed actions were driving US stock prices. He has tracked and reported on that relationship for his subscribers ever since. Try Lee’s groundbreaking reports on the Fed and the forces that drive Macro Liquidity for 3 months risk free, with a full money back guarantee.


