We have covered the ugly implications of the crash in multifamily housing starts. Now it’s on to the more prosaic picture in single family starts.
The mainstream media noted that single family starts are still trending upward. As the Wall Street Journal put it, starts “remained at a level suggesting steady demand for single-family homes amid low interest rates and steady job creation.” They added, “November’s three-month moving average of single-family starts, which smooths out some of the monthly volatility, registered at the highest level since the end of 2007.”
It’s all true, but backward looking. It may look ordinary, but considering what has happened in the mortgage market over the past month, a forward look from here presents a tableau fraught with danger.
Note what the Journal said and didn’t say. Single family starts remained at a level… Past tense. They didn’t say “will remain”, or even just “remain.” The phrasing was precise. In November they “remained.” The Journal didn’t bother to venture a guess about December because the spike in mortgage rates would require a degree of negativity. That’s something that Realtor.com, an affiliate of Dow Jones under the News Corp. umbrella, just can’t have.
My bet would be that rising rate have an impact sooner rather than later, but sometimes there’s a little surge in buying when rates start to rise. However, buyers are probably already maxed out in terms of qualifying for a mortgage. Home prices are still inflating at triple the rate of wage and salary inflation. Under these conditions, the increase in monthly payments will start to put the brakes on the market.
The Journal also said that the November level was “suggesting steady demand for single-family homes amid low interest rates and steady job creation.” Again, this was a look back at the conditions that led to the so called steady demand in November. It did not mention or condition the statement on the fact that mortgage rates have risen sharply, and that job creation may or may not remain steady in the face of threatened higher rates.
The online real estate brokerage firm Redfin reported that housing inflation rose to 7.7% year over year, based on contracts signed in November. That’s the fastest inflation rate in 14 months. It’s also a radical acceleration from just over 4% in September.
Redfin’s data covers 42 of the largest and most active metro housing markets in the US. Combine rising prices with rising mortgage rates, and it’s not just “Houston, we have a problem.” New York, Miami, San Francisco and all points in between have a problem too.
Finally the Journal made up a flimsy excuse that 3 month average sales were at the highest level since 2007. It’s true, but it only means that starts were above the 2008 level. November 2008 was virtually the bottom of the housing crash. It was a terrible year.
Now that we’ve parsed the language of the housing industry’s leading marketer, Dow Jones and its affiliates, Realtor.com and News America Marketing, let’s go to the real numbers and see what the deal is.
Single family starts fell to 60,700 units in November, a decline of 16.5% from October. This is an actual reading before seasonal adjustment, but subject to revision as more data becomes available.
Normally November sees a decline, so the fact that starts were down is unremarkable. However, the drop of 16.5% was worse than November 2015’s 3.2% decline. It was also worse than the 10 year average November decline of 13.5%. It suggests a drop in the upward momentum of the past 2 years.
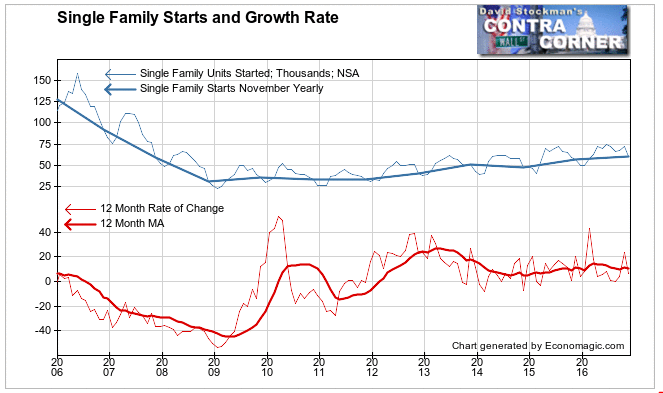
Still, the drop left November’s number 6.5% above November 2015. The 3 month average was 11% higher than the 3 month average over the same period last year. So the Journal’s portrayal of the trend as steady is accurate. Here’s what it looks like, with the all important element of perspective that’s lacking in the news reports.

The growth rate remains stable at about 10% yearly but with starts less than half the number at the peak of the housing bubble. This is 7 years after the bottom of the crash, and after 5 years of recovery.
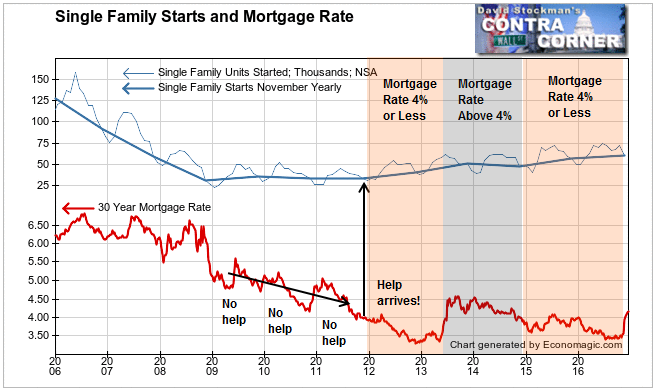
Here’s another important perspective. The uptrend in starts appears to be highly dependent on ultra low mortgage rates. Starts only started to improve when the 30 year fixed rate dropped below 4% late in 2011. They stopped improving when rates briefly shot back above 4% in 2013. Just over the past few weeks the rate edged back above 4%. The future would seem to depend on where mortgage rates go from here.

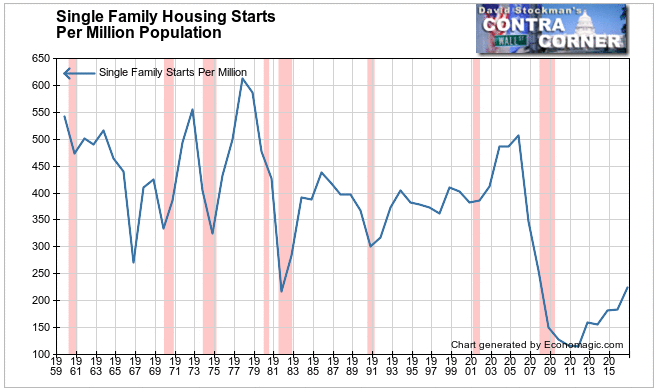
Here’s another perspective. The rate of sales has improved over the past 5 years from the lowest level in history. In 2011, November starts fell to a rate of about 104 starts per million population. As of this November they had rebounded to 187 per million.
But that’s still below the second lowest rate since records were kept on this data. That low was set in 1981. The 30 year fixed rate was 18.5% that year! At that time starts fell to 174 per million of population. Today with the help of mortgage rates at 4%, we’re barely above that. The combination of massive housing inflation and slow wage growth has been a killer for the housing industry.

In my Wall Street Examiner Pro Trader service my focus is strictly on technical analysis. With fundamentals like this it’s no wonder that I was able to recommend a short of XHB, the homebuilder ETF, based purely on the chart pattern.
Only about 25% of the weighting of the XHB is comprised of homebuilders. The rest is building materials manufacturers and suppliers, and home furnishings and hardware retailers. With mortgage rates rising, and worker salary increases falling further and further behind house price inflation, all of the subsector components of XHB seem likely to do poorly for the foreseeable future.
Try Lee Adler’s Wall Street Examiner Pro Trader Market Update service, including long and short ETF trading recommendations risk free for 90 days. Click here for information.


