The most troubling aspect of the payroll reports month after month through the “best jobs market in decades” was how the counted labor force seemed so entirely apathetic to it. If jobs were suddenly plentiful, it would stand to reason that Americans and the deep pool of them sidelined since the Great Recession would be lining up to participate. Because that didn’t happen, questions about the validity of the headline Establishment Survey numbers and the unemployment rate were included within those very same monthly updates.
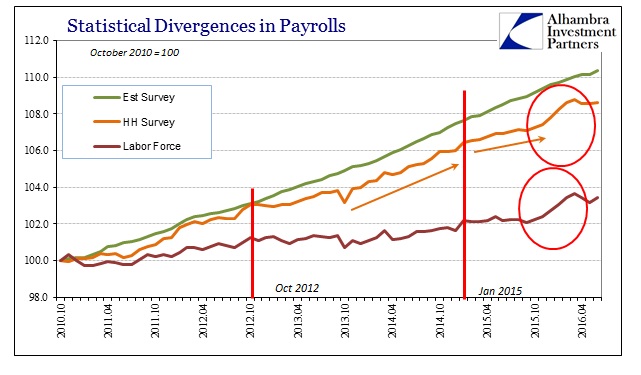
That all suddenly changed with the October 2015 release. All of a sudden, the labor force shockingly and sharply came to life, with more than 2 million joining up in only a condensed six-month period through March 2016. It happened just as the Fed decided the recovery was completing and that the economy was shifting more toward overheating. The growth in the labor force could not have come at a better time to add some much needed validity (or at least to soften some doubt) to what they were seeing and thinking.
The nature of that surge, however, was itself dubious. The rise in labor participation would not if organically-driven apply all at once; it would be, as in the past, a more sustained action rather than taking the form of a sudden and conspicuous spike. The Household Survey showed a related surge that also argued for a potential statistical explanation.

Further, the surge is apparently over, with the labor force and Household Survey reverting to their prior lackluster patterns. I raised this issue back in April, coincident to the March payroll report.
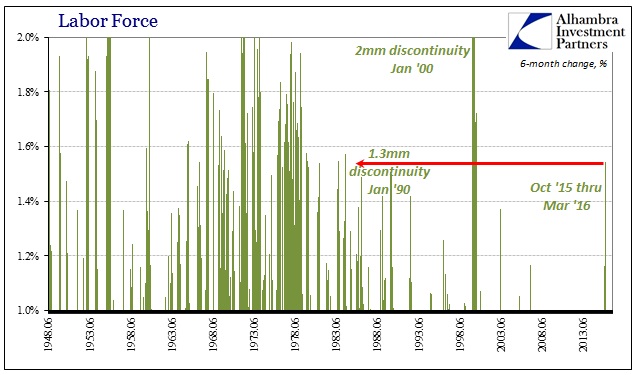
That is the problem; such as an expansion is literally out of place for not just this cycle but the past three decades. The BLS estimates that again since September 2015, during some of the worst financial turmoil since 2008, a manufacturing recession and enormous uncertainties about the global economy, the labor force grew by 2.4 million.
The scale of that surge is unprecedented for these sorts of circumstances. The last time the labor force grew by the same amount (in percentage terms; omitting the discontinuity of January 2000) was July 1984. There is absolutely nothing about the economic climate of late 2015 and early 2016 that suggests even the smallest hint of 1984.
With the addition of a few more months, it does seem reasonable to suggest that the spike has ended and that it was, in fact, a temporary occurrence. With that in mind, there is a very reasonable non-economic relationship that would account for what we see.

As part of the “stimulus” efforts following the Great Recession, the Supplemental Nutrition Assistance Program (SNAP) defrayed its work requirement. As part of the 1996 overhaul of the nation’s welfare framework, all able-bodied adults aged 18-49 were given only three months of SNAP (then called foodstamps) in any 36-month period before they had to prove they were working, undertaking vocation or educational programs, or volunteering more than 20 hours a week in order to qualify for additional benefits. The depth of the recession allowed the federal government an economic justification to temporarily rescind this constraint; at least for any states that individually apply for it so long as economic conditions suggest continued labor difficulties.
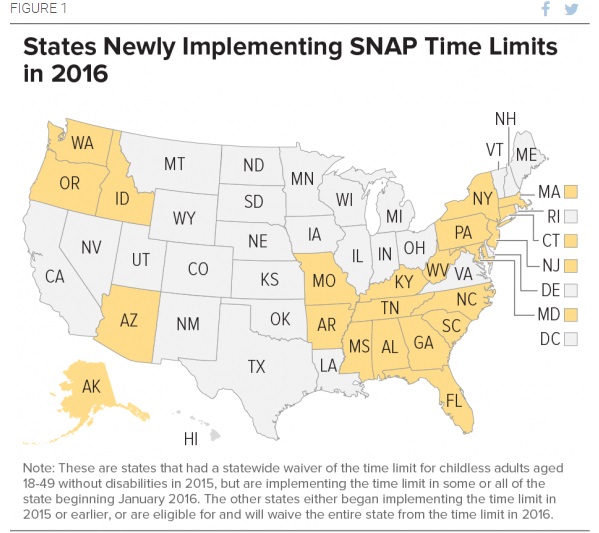
Ironically, because the neutered unemployment rate is falling so far so fast, statutory limits are starting to take away some states’ discretion whether they wish to continue with the waiver or not. My understanding is that each state had to notify the federal government by September 1 last year whether they were intending or qualified to continue to receive the waiver eliminating the work requirement. If they were unable to remain or chose not to do so, the work requirement would go back into effect on October 1, meaning that SNAP recipients would have until the end of the year to report they were working in order to continue to receive benefits starting January 1, 2016.
As of June 2015, 44 states were operating on a full or partial waiver. Last fall, however, 22 states brought back the work requirement in full or in part; 19 due to the unemployment rate and economic criteria; 3 as a matter of state political choice. Those states that were in this pool included some of the most populous, such as New York, Pennsylvania, Florida, and Arizona. California, Michigan, and Illinois remain approved for full statewide waivers as of July 1, 2016.

What we have, then, is a statutory requirement potentially applying to millions of Americans to at least start reporting that they are working on October 1, 2015, in order to remain eligible for SNAP by January 1, 2016. The BLS’ figures for the labor force show us that starting with the month of October, the number of people in the sample who reported being both employed (HH Survey) and part of the labor force suddenly and sharply increased at exactly that moment.
The USDA further notes that states are not required to match their re-imposition of these work requirements with calendar quarters or even fiscal federal government periods. That would suggest that some of these states may have delayed the implementation to as late as the end of Q4 last year when the 22 waivers were rescinded. That might explain why the surge in the labor force lasted six months rather than just three; staggering the timing of the start of the 3-month window across them such that the latest of the states would be reaching their work limit requirements around and in March 2016.
I have not seen in any of the press or statistical releases from the BLS since last October any reference to SNAP or work requirements. I have contacted the BLS to see if I am missing any reports or notices with regard to these major statutory changes, or, absent that, if they have any explanation so far unpublished to account for all of the labor force surge, the Household Survey surge, and why it so neatly fits with the changes in SNAP work requirements. They have not, as yet, responded to my inquiry. When they do, assuming there is anything of note, I will update this post.
Not all of those formerly on SNAP under state waiver reported working; in March 2016, the USDA reported a huge drop in caseloads – the largest single month decline since the expiration of temporary benefits after Hurricane Katrina in 2005. That sharp reduction further proposes that there was a very large effect from the 22 states that shifted SNAP requirements.
There is, of course, a great many unknowns here; including what amounts to making a claim that several million Americans reported working when they may not be. At least on that count, we know the motive; but we also have harbored these kinds of suspicions all along, namely that the increase in the labor force wasn’t actual or real. Back in April, Bloomberg reported several anecdotes that suggested the labor force wasn’t actually changing at least as far as reaching the desks of those working at employment agencies:
While the government has reported that the labor force has grown by more than two million workers over the past six months, Funk said he isn’t seeing that in his business, with the number of people he has available to fill jobs down from last year.
Tom Gimbel, chief executive officer of Chicago-based staffing company LaSalle Network, is seeing some people come off the sidelines and resume working. But it’s more a trickle than a torrent, he said, adding, “I think it’s running pretty dry.”
In addition, there is the more basic deficiency of why a sudden and huge marginal increase in work and labor didn’t alter in any way the economic trajectory in any economic account. It was if all that changed were the number of people reporting themselves in the labor force and working; there was no account of greater aggregate income, spending, or anything else (all of those only got worse). This sudden and sharp surge was contained, as it has been for years now, entirely within the BLS’ estimates, arguing more for a statistical, sampling error.
I don’t make these charges lightly (which is why I have waited quite a long time to publish my suspicions) as I fully realize it amounts to suggesting widespread fraud. Given that, however, it would at least be consistent as to why people who aren’t actually working would report themselves that way; being contacted by the BLS in an employment survey, would one risk telling the BLS one thing contrary to what one told the state “welfare” officials even if the reason for contact from the BLS had nothing to do with SNAP? Most people would, I believe, answer consistently in both government contacts if for no other reason than great (unfounded) caution lest one be able to verify with the other. If you were to report yourself working, you would very likely report yourself working to all the government, not just one part or distinctly between federal and state.

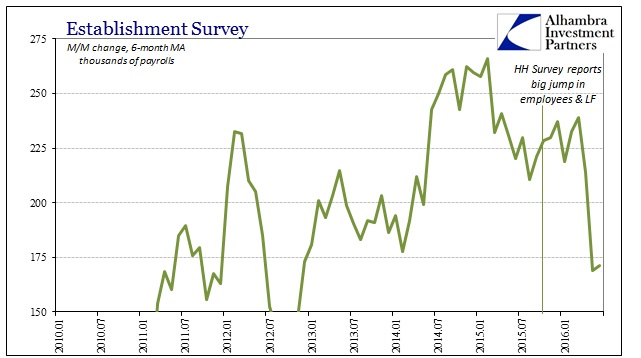
This addendum to the theory is supported by the differences between the Household Survey and Establishment Survey during the period in question; the former, taken from a survey of self-reported employees, reported a jump while the latter, taken from a survey of employers, did not (and in fact has only suggested significant slowing in the labor market during this time). There are often differences between the two surveys, but it stands to reason a sharp rise in the Household Survey would be corroborated at least in part by the Establishment Survey, rather than moving more so in opposite directions.
I do not think this theory is anywhere close to conclusive, but I do believe it reasonable enough to raise it publicly – especially as the jump has both ended coincident in timing to the beginning and end to the SNAP/work change, and doesn’t show up anywhere else in the economy even though it really should have. If I am correct, it would offer a further non-economic explanation to what has been taken incorrectly as an improving economy. At the very least, it is sufficiently cohesive and coherent an argument to warrant more study and scrutiny; and, as always, raise still more questions about what the BLS numbers actually mean.
UPDATE
Full and expected (non)response from the BLS is below.
TEXT OF MY ORIGINAL EMAIL TO THE CPS BUREAU:
I have not found any technical note or explanation for the unusually large increase in the reported labor force from October 2015 through March 2016. I have searched through press releases and the Employment Situation Report. My questions on the labor force are as follows:
1. Has the BLS provided some answer, whether narrative or technical, for the very unusual surge in the calculated labor force (and the related, I assume, Household Survey)? If so, I would kindly ask that you forward anything (a link would be sufficient).
2. If this trend has not been addressed, can you comment on whether you surmise, suppose or have found any links between the labor force change and the removal of applications for waivers from SNAP work requirements. As I understand it, notification to the Federal Government would have taken place in September for any state, and that 22 (additional) states chose or were forced to do so. The renewed work requirements would have been imposed by January for full effect by the end of March. Thus, the correlation in terms of timing and just plain common sense recommends study and comment.
I sincerely appreciate any information you may be able to pass along. Since the jump in the labor force was historically out of line and unusual, it would be very helpful if there were more detail and granularity to it. Thank you in advance for any effort and time.
Jeff Snider
RESPONSE FROM THE BLS:
Hi,
BLS has not issued a technical note regarding intra-year labor force growth patterns in 2015 and 2016 (to date). Labor force and employment changes as measured through the Current Population Survey (CPS, or household survey) can be highly variable from month to month and even for periods of several consecutive months; sampling error, and sometimes atypical seasonal patterns, tend to top our list of factors to be considered. Population controls, implemented in the CPS with the release of January data each year, must also be taken into account during the period in question.
These are some of the factors that can make it challenging to discern meaningful short-term changes in trend in CPS time series data. (It is worth noting that total nonfarm payroll employment as measured through the Current Employment Statistics survey (CES, or establishment survey), which is subject to some of the same factors, doesn’t seem to show much of a departure from trend during the period.)
As an independent statistical agency, it is not BLS practice to study the impact of policy changes. You may wish to contact the Council of Economic Advisors, Congressional Budget Office, or perhaps the policy arm of the U.S. Department of Agriculture, to see if they have examined the issue you raise.
Regards,
Division of Labor Force Statistics
Bureau of Labor Statistics


