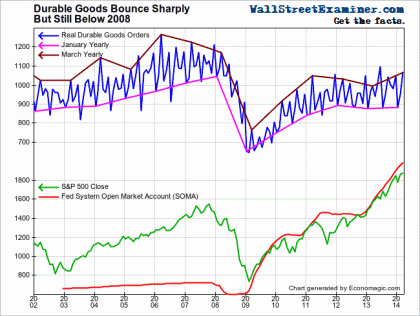
Actual, not seasonally adjusted real durable goods orders rose 12.1% in March from February. March is typically the strongest month of the year. The current number represents below average performance. The 10 year average gain for March was 14.4% from 2003 to 2013. These are inflation adjusted numbers representing actual order volume, not nominal sales.
The year to year gain was 7.2%, which represents a rebound from weakness in the past 3 months. The trend had been flat for the past two years.
This gain puts real durable goods orders slightly above the recovery peak in 2011, but still 9% below the March 2008 level, which was in the early stages of the depression that continues today. While the Fed has had great success at stimulating a stock market bubble, QE has not moved the needle on US manufacturing, or demand for US manufactured durable goods. Real durable goods orders remain below the levels of 2002, also at the bottom of a the internet/tech bubble collapse recession.
The seasonally adjusted made up headline number rose by 2.6%. Conomists had expected a gain of 2.0%. Therefore this was seen as a “positive surprise.” in spite of the actual data being below average for March.
Transport equipment is a large and volatile segment of US durable goods manufacturing. Conomists exclude that to form a “core durable goods measure.” There, the long term trend is even more pronounced. Even with a strong bounce in March there is no breakout, and the long term downtrend remains intact.


![M1080202042052133403311787724[1]](http://wallstreetexaminer.com/wp-content/uploads/2014/04/M10802020420521334033117877241-420x248.gif)

