I remember Black Monday of 1987 well. It was a nice October day.
I was working as a bartender at the Magnolia Cafe in Center City Philly. I had left Wall Street 3 years earlier. Then in May of 1987, after the first leg of the 1987 bond market crash, I was fired from my job as a mortgage broker. I wasn’t the first of my colleagues to be let go, nor was I to be the last. It was a bad scene in the real estate business that year.
I remember how excited I was as I was crossing Rittenhouse Square on my way to start the 5 PM shift. I was still following the stock market closely every day. I had seen the news about the stock market crash on FNN throughout that day. The Square was buzzing with the excited chatter of the options traders and brokers coming out of the Philly Stock Exchange. The tension in the air was palpable.
I was a big bear on the market back then but I couldn’t enjoy that day much. After all, I was working as a bartender. I wasn’t trading. I felt sad that I could not have been short that day. I knew people who were short and made a pile of money.
It would be another 6 months before I landed a good job in Florida appraising commercial real estate and gradually getting back to following the market in earnest.
Times were tough for many of us in the 1980s. There were plenty of people my age making lots of money, but many who were struggling, just like today.
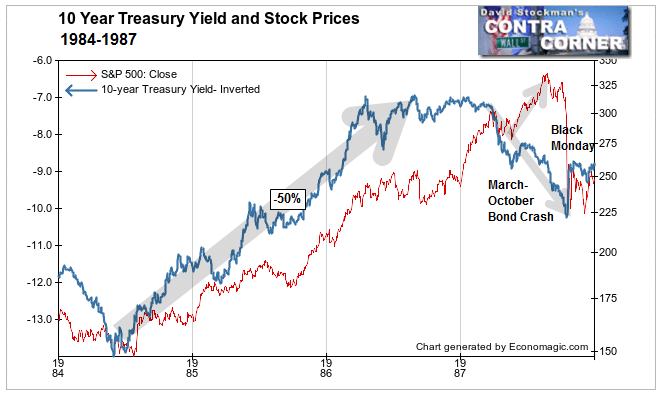
There are other parallels. The bond market had crashed over the preceding 6 months. The first wave down took yields from 7% in early January, through a slight rise of about 25 basis points until March. Then the sheet hit the fan, and yields shot from 7.25 to 8.9% in mid May. The mortgage market seized up, and housing sales froze. I could not write a loan to save my life. The axe fell.
The bond market rebounded briefly in May and June, but it only brought the 10 year yield to around 8.3% before and just after the Fourth of July. Then bond yields started up again, rising from 8.29 on July 6 to 8.66 by the end of the month. By the end of August they hit 9%. The real estate market was dead, the mortgage business a shambles. It was a scene repeated in cities and towns throughout the US.
But stocks were roaring higher and Wall Street was partying, oblivious to the pain and suffering of bond traders, mortgage brokers, and real estate salespeople. The salespeople were now starving after going 4 months without earning any commissions. I was one of the lucky ones. I had a job tending bar in a hip restaurant. I had a great family meal before my shift every day, and then spent 7 hours slinging drinks to a yuppies 4 or 5 deep at the bar. The money was good.
Meanwhile, in the bond and housing market, things continued to get worse. From 9% on August 31 the 10 year yield rose relentlessly to 9.63% by the end of September. Then in October, it looked like the end of the world. The 10 year topped out at 10.23% on Friday, October 16, an increase of 46% from the March low of 7%.
The party on Wall Street ended with a bang. The stock market crashed on Monday October, 19. From October 14th to 19th stocks lost 30% of their value.

This chart is plotted with bond yields inverted on a log scale. Price is the inverse of yield (subject to adjustments for remaining maturity). This way you can see the direct correlation between bond yields and stock prices as you would if bond prices were plotted instead of yields. As yields decline, prices rise. Stock prices and inverted bond yields rose concurrently from mid 1984 after a year long correction in both markets, until the end of 1986.
Then things went haywire. Bond yields hit their lows in January (bond price high). But after 3 years of moving in lockstep with bond prices, stocks broke out to the upside. Stocks diverged sharply from bond prices, which were collapsing as yields rose. By March stocks had risen by nearly 20%. Stocks pulled back between March and May.
The first leg of the bond market crash accompanied that pullback. The bond market had a small rally in June and July, but then started down again.
Meanwhile the stock market tacked on another 13% from June to August. Bond prices had started down, and bond yields up, in March. It took 5 months from the time bonds had started to collapse in March until stock prices finally topped out in August. It was a manic run. By that last leg up in stock prices, virtually everybody had turned bullish. Among mainstream Wall Street soothsayers, nobody, but nobody, was bearish.
Sound familiar?
Fast Forward to The Present

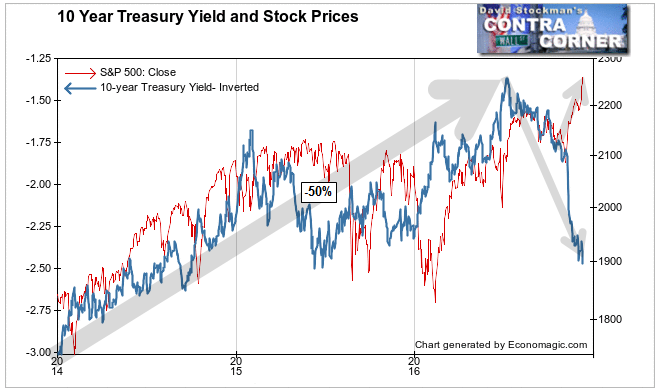
From 2014 until July 2016, a period of 2.5 years, bond yields declined by 50%, the same as in 1984-1987 over the same amount of time. Stock prices continued to rise for 5 months after yields started rising. The stock market had a little correction in August-September and a small bounce into October. It took 2 months from the August market peak until the stock market crashed.
Here in 2016, bond yields have risen by 72% in 5 months. In the initial stage of the rise in yields, stock sold off for a couple of months, just like in 1987. But since that correction, stock prices have risen by 8.3%, and we don’t know yet whether they have topped out.
I’m not about to tell you that history repeats. Every era is different. But the technical and psychological profiles between the 1987 experience and today are eerie. For me they are particularly haunting because they came at a time of struggle and survival in my life. So many Americans today are experiencing similar struggles. Meanwhile, the stock market goes on its merry way, with Wall Street ignoring, even celebrating, the fact that bonds are crashing and bond yields are soaring. They even treat that rise in bond yields as if it is somehow good news.
If 1987 is in any way relevant, then The Street is likely to be proven wrong within the next 2 months. As soon as there’s any sign that the rally has peaked, I would view that as a signal to get out of long positions immediately. I would also put on short positions to my comfort level, or a few speculative put positions. If I could not sell my stocks, I’d by puts for protection.
Note: The story you have read is true. The descriptive details may or may not be embellished or exaggerated for allegorical effect. The numbers are true.
Lee first reported in 2002 that Fed actions were driving US stock prices. He has tracked and reported on that relationship for his subscribers ever since. Try Lee’s groundbreaking reports on the Fed and the Monetary forces that drive market trends for 3 months risk free, with a full money back guarantee. Be in the know. Subscribe now, risk free!


