There were some interesting data points in Thursday’s housing starts news. None of it suggested that a downturn had begun, but a few canaries were coughing and wheezing in the coal mines. It’s starting to sound like a West Virginia Republican Congressman’s town hall meeting.
Meanwhile, the public relations arm of Realtor.com and News America Marketing –“Your marketing objectives are our business (news)”– was predictably ebullient. The Wall Street Journal’s PR went like this .
Housing starts rose 3% in February from the previous month to a seasonally adjusted annual rate of 1.288 million, above the revised January rate of 1.251 million, the Commerce Department said Thursday.
The pace of single-family starts in February was at its strongest level since October 2007, and the figure for single-family permits last month was the best since September 2007.”
That 3% gain was a seasonally adjusted (SA) month to month change. It’s an imaginary number based on an arbitrary statistical formula, that may or or may not accurately represent the trend. It will be revised in each of the next 2 monthly reports and once a year for 5 more years.
We never know if the first release is anywhere near the real trend. That can only be seen by using real data. So we use the actual not seasonally adjusted (NSA) survey data. That will get revised twice over the next 2 months. The first revision is typically minor. The second revision is too small to have a measurable impact. Sometimes there’s no revision in the second month after the initial release for the current period. The initial release of the NSA data is usually pretty close to the mark.
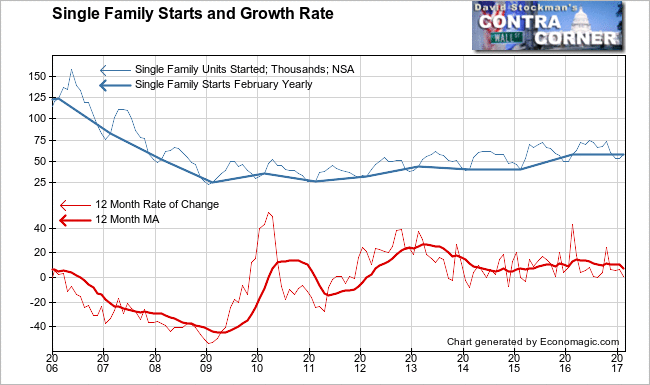
Surprise surprise, the February NSA data was pretty strong. It had a pop of 5,000 units from January to 58,500 units. The 5,000 unit gain wasn’t quite as good as last year’s February gain of 7,800. But it was better than average. Over the previous 10 years, February has had an average gain of around 1,900.
The Journal did point out that February was freakishly warm in the Northeast and Midwest. That could have contributed to a few more shovels going into the ground in February. That will pull some starts forward from March. March should see a lower than normal gain. In addition March in those regions have been really miserable, weather wise. So if weather matters, the March numbers are going to stink. Anything less than a 3,700 unit increase will turn the year to year comparison negative.
Year to year, February had a gain of 500 units, or 0.9%. A downward revision for this month’s number in the next report would probably turn the year to year gain for February into a decline.
Finally, when we look at a chart, we say, “Wow! I wonder what the Wall Street Journal and Wall Street are so happy about?” Traders sure weren’t buying it. The homebuilders’ ETF, XHB, slipped 7 cents on the day on Friday. OK, so it wasn’t exactly “Sell the news!” 
So yes, starts were back to 2007 levels. But exactly what does that mean in terms of the future? Nothing. A trend can top out above or below a previous peak. The real issue here is that there was certainly no 3 % increase. A tiny revision of the February data, or the fact that February probably stole a few starts from March, will turn the trend negative.
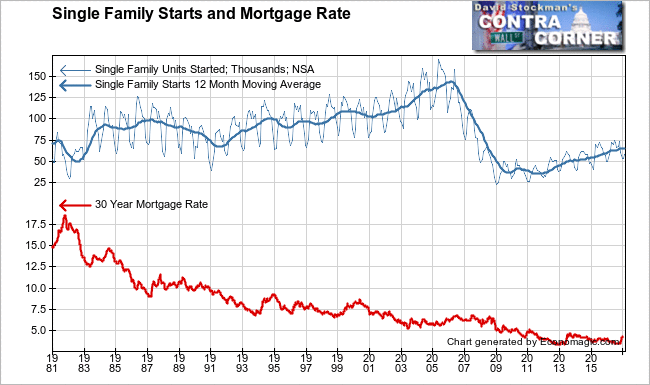
Then there’s the issue of perspective. That is an issue for both the long term trend and mortgage rates. The 12 month moving average shows that on an annual basis, starts are not even back to the level of the 1991 recession low. That’s in spite of the persistence of mortgage rates at or below all time record levels since 2009. You would think that with this kind of wind in the market’s “sales”, the recovery in starts would have shown a little more energy. Instead, it looks like it’s running out of energy.

We have to ask ourselves whether this pop in rates from 3.4% to 4.2% was a factor in causing the growth rate of housing starts to drop to near zero. And if it was, what happens when mortgage rates resume their rise? I think we all know the answer.
The initial rate pop has probably moved fence-sitters off the fence. Those who can afford to buy at these levels of rising prices and rising mortgage rates have done so. What’s left is the dregs.
There will be fewer buyers, and it will be tougher to get mortgage approvals for those buyers. Builders start building a house when they have a contract in hand from a buyer. So I suspect that one of these days, starts are going to go off a cliff without a parachute.
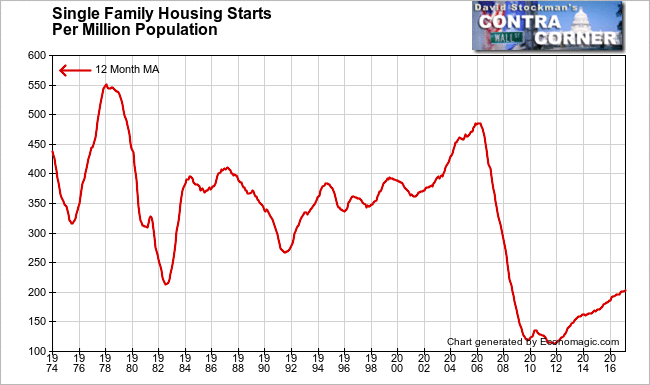
None of the raw data accounts for demographics. The chart above covers a period of 35 years plus. US population has grown by about 42% since 1981. In 1981, mortgage rates were 16-18%. You would think that with 42% more people and mortgage rates barely a quarter of what they were then, that starts would be more than 42% higher than in 1981-82. A lot more. But in 1982, there are 210 sales per million people per month on average. Today, that number is about 201 sales per million. 
The canaries are coughing. The smart ones are escaping the coal mine while they can still fly.
Follow Lee’s weekly market timing reports, including ETF trading recommendations, in the Wall Street Examiner Pro Trader Market Updates. Try the service risk free for 90 days.


