
The Census Bureau and HUD reported on Friday that new home sales in the US rose to a seasonally adjusted (SA) annual rate of 555,000. “This is 3.7 percent (±18.5 percent)* above the revised December rate of 535,000 and is 5.5 percent (±25.4 percent)* above the January 2016 estimate of 526,000.”
The quoted text is a lifted directly from the government’s press release. Note that the margin of error is 5 times the reported change. So I guess they really have no idea what the actual number of sales was.
I track only the not seasonally adjusted data representing the number of homes actually sold that month, and have done so for many years. I have not seen that be revised by more than about 5-10%. The use of SA data is problematic because it multiplies the monthly error by 12, which is one reason why the stated margin of error is so large. The other reason is that the initial data is based partly on a tiny sample survey, along with building permit data.
Long term time series charts of the not seasonally adjusted data remain the best way of judging the state of the trend in the single family housing development industry. This industry currently makes up about 1% of GDP. We look at some of those charts below.
Here’s how the Wall Street Journal reported the story:
U.S. New-Home Sales Rose 3.7% in January
Economists expected new-home sales to increase more strongly
The Journal made note of the margin of error problem casting doubt on the numbers, but then went back to the usual bullish take with quotes like these:
New home sales rebounded in January after posting a steep decline in December, an indication that the new-construction market remains on the path to recovery despite bumps along the way…
Economists expect new-home sales to continue to increase this year as builders step up construction of single-family homes and more first-time buyers come into the starter-home market.
The full government report contains a wealth of data which enable us to take a deep look at how the industry is currently doing relative to where it has been and where it may be headed. That in turn can tell us when the stock market may be following a false narrative, providing a possible opportunity for profit by trading counter the crowd. The timing of those trades would be guided by technical analysis, which is the study of indicators of stock price trends and cycles.
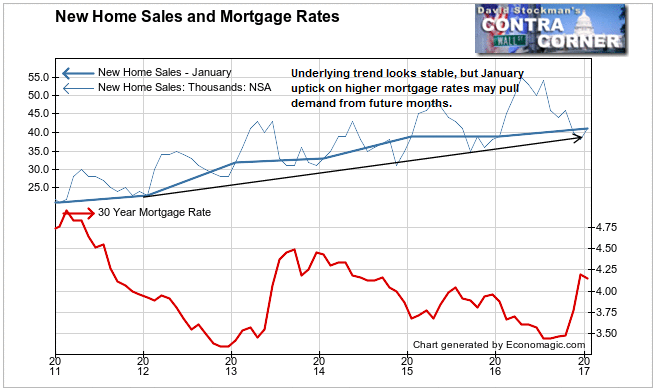
First we look at the reported NSA data representing the actual number of houses sold in the month. A total of 41,000 units were reported to be sold in January. That was 2,000 units, or 5.1%, more than in January 2016. The 3 month total of sales was also 5% greater than in 2016, so the trend looks consistent. It has grown at a slower rate over the past 2 years than between 2011 and 2015. Lower mortgage rates have not spurred growth.
On a month to month basis, sales rose by 3,000 units. Over the prior 4 years sales always increased in January. The increase for last month was more than the 1,000 unit increase in January 2016, but less than the 4,000 unit increase in January 2015.
On the whole, the raw data shows little sign of trend change in the short run. Here’s how it looks on the charts.
Charted alongside mortgage rates, the year to year increase in sales is surprising. The rise in mortgage rates probably spurred fence sitters to make their move now under the threat of higher rates. Such fear driven stimulus–buy now before rates rise–would typically steal demand from future months.
Only showing the past 6 years, which is how the mainstream media usually shows the data gives a false picture of health.
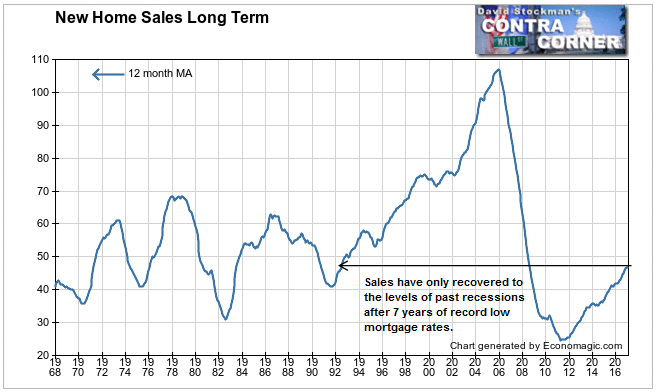
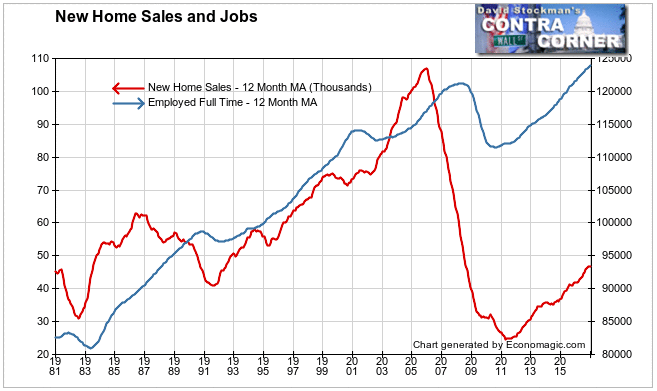
Sales have only recovered to the levels of past recessions. This so called recovery has been at a slower pace than any previous recovery. It has had the help of increasing population, constantly falling mortgage rates and a recovery in the number of jobs since 2009. Yet sales have only recovered to the levels previously hit in the 1991-92 recession. The country’s population has grown 25% since then.
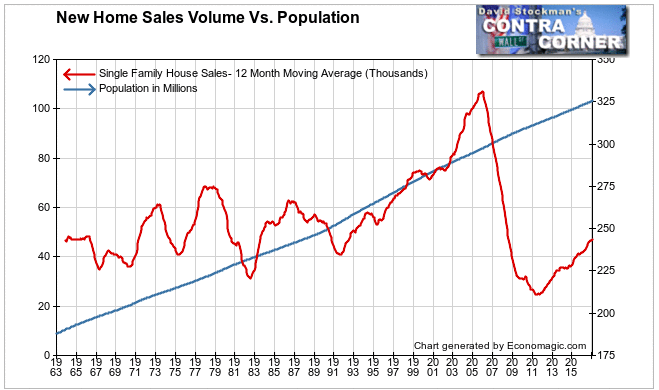
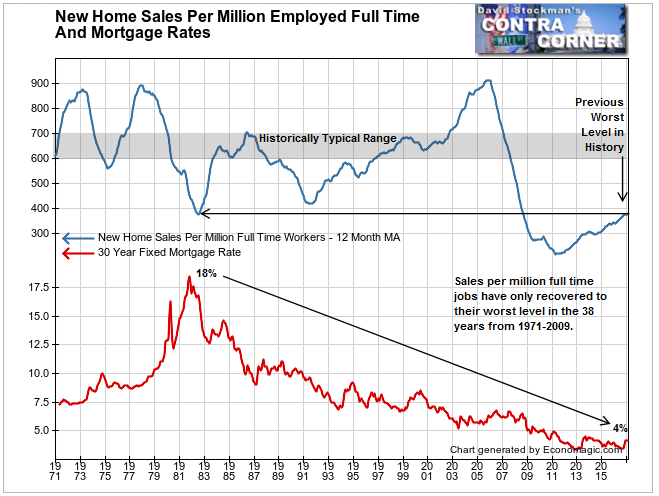
Here’s how sales look on a population adjusted basis, alongside the mortgage rate trend.
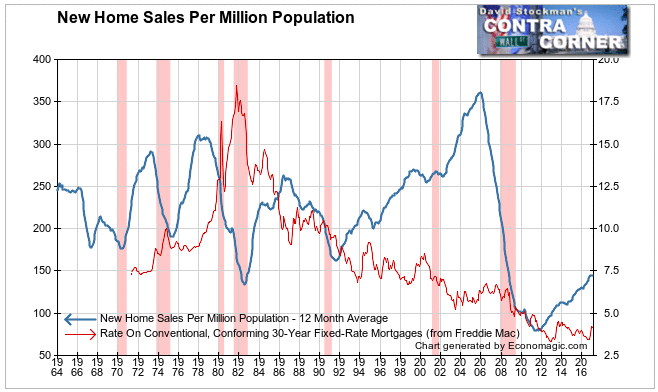
On the basis of sales per million of US population the current sales rate has barely reached the level reached at the bottom of the 1982 recession when Paul Volcker had pushed mortgage rates as high as 18%. By contrast today, the recovery has had the help of 4% mortgage rates and sales are only running at the average monthly rate of 150 per million people. That’s even lower than the bottom of the 1992 recession, when sales fell to an average rate of about 160 per million. Mortgage rates were 8-9% at that time.
This highlights the problem of the current US jobs recovery. In the past, new home sales trended with jobs. While moving up along with the number of jobs today, sales are growing far more slowly than in relation to past recoveries. And sales have never recovered to their past ratio to jobs. The recession and subsequent monetary policy have correlated with a fundamental change in the ability of new jobs to make the purchase of a new home affordable. We think that’s causal, a subject I have covered in past posts.
Sales today average less than 400 per million full time workers per month, with mortgage rates around 4%. Prior to the recent recession and “recovery,” sales per million full time workers were only this low when mortgage rates were 16-18%. The current average monthly sales of approximately 380 per million workers compares with a typical historical range of 600-700. That was during a time when mortgage rates were between 7-10%.
Clearly the jobs being spawned by today’s ZIRP distorted economy will not support new home purchases at the rate they once did. This is the cloud behind the silver lining of current slow growth new home sales data. Under these circumstances, the US economy simply cannot afford any additional increase in mortgage rates. The Fed has painted itself into a corner, with apparently only 2 pathways out. Allow a rate rise and severe economic contraction. Or conversely, continue to support slow and steady degradation of US living standards as ZIRP distorts economic incentives away from productive investment.
We’ll look at more of the new home sales data, including sale prices, and the distribution of sales by price range and region, in upcoming reports.
Follow Lee’s weekly market timing reports on gold, as well as mining stocks and ETFs, including trading recommendations, in the Wall Street Examiner Pro Trader Precious Metals Updates. Current picks have an average gain of 14.4% and an average holding period of 47 calendar days. Try the service risk free for 90 days.

