
The payroll report missed badly, as the headline “job creation” number gained only 38k in May 2016. That was the lowest monthly gain of the entire “recovery.” Last month’s figure, which had already caused significant angst, was revised even lower to just 123k. The mainstream is predictably apoplectic, and why wouldn’t it be? After all, month after month after month there was only the Establishment Survey and unemployment rate to hold off the steady rise in uncertainty, the determined approach of negative signs in more and more places. If the Establishment Survey turns too, there is nothing left. Even “full employment” will be transformed from a serious signal of full economic health to nothing more than marking the cycle peak.
I seriously doubt there were even 38k jobs gained last month, as the BLS doesn’t measure that only chained monthly variation. What’s important and relevant is not the headline number especially in any single month but rather the direction and intensity of the variation. On that score, there might be meaningful developments, perhaps threatening to make the labor statistics relevant again.
With the latest revisions (non-benchmark) and the current estimates, the Establishment Survey has been less than 190k in four of the five months of this year. The six-month average gain has dropped to just 170k, the lowest since November 2012 – the start of the slowdown.
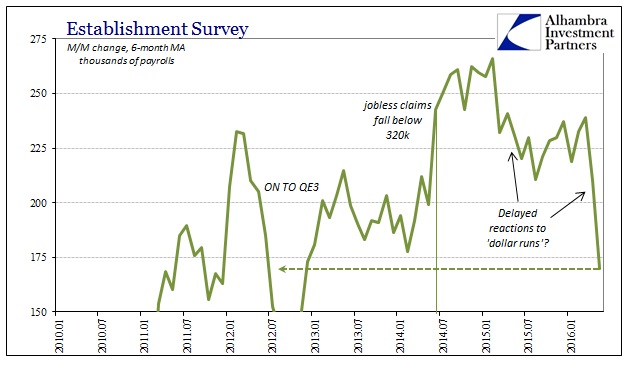
The pattern in the average is unmistakable once you set aside questions about its altitude; it follows the successive “dollar waves” or runs with a few months of lag. The first drop in the average starts in February 2015 and ends at August, matching the first “rising dollar” episode that hit hardest at the end of 2014 and beginning of 2015. The second “dollar” event, by far the worst so far, began in July 2015 and kept right on through January and February, encompassing both global liquidations; with the latest drop in the payroll average close behind.
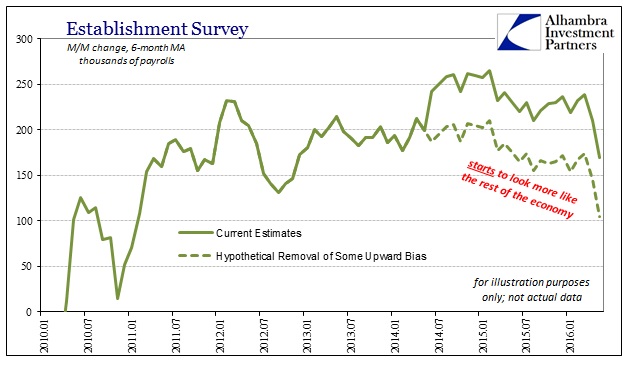
What matters is not the current 170k average but the direction in which it is going. If I am right about economic statistics in 2014 and early 2015 being highly overstated, and the evidence is only mounting for it, including yet another negative benchmark today (more on that later), then we don’t really have any idea what and how low payrolls might actually be. If we crudely erase the “best job market in decades” then the Establishment Survey only begins to make sense with everything else we find around it (especially anything tied to US consumers and consumer spending).
The rest of the payroll report was equally as bad, with the labor force dropping once again this month. Combined over the past two months, the official labor force estimate has fallen by 820k, erasing a third of the statistical gain from the prior six months. The unusually large changes back and forth again suggest statistical problems in the series rather than economy, good or bad.
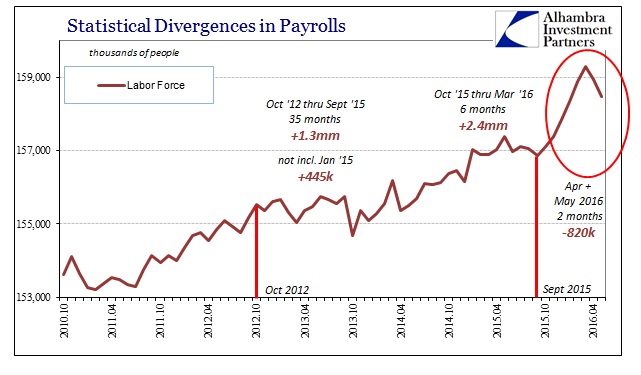
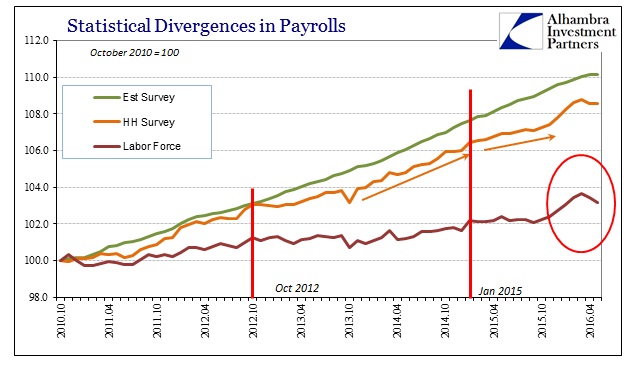
Further, the labor force estimate appears quite more attached to the Household Survey than might be expected, offering one possible answer as to the statistical oddity here (running through the unemployment rate; but that is a separate topic).
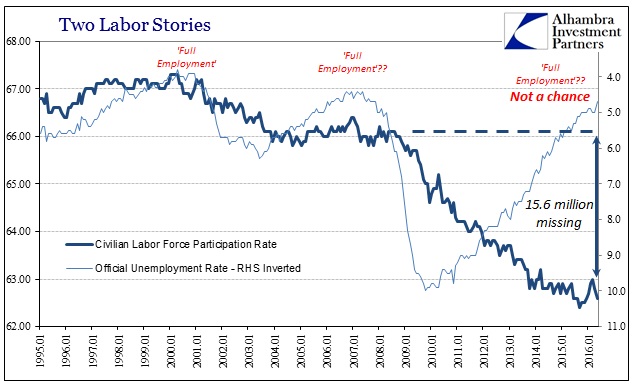
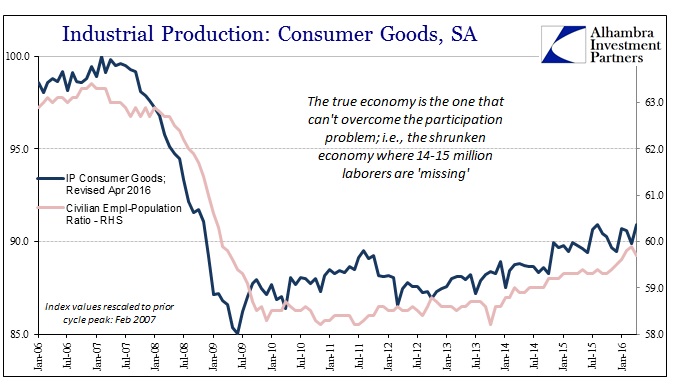
Because the labor force has retracted somewhat, the running tally of how much the US economy might have shrunk via the Great Recession is back again close to 16 million people. Since the prior “cycle” peak, the potential labor pool (civilian non-institutional population) has grown by 20.2 million, yet the official labor force has only added 4.6 million of them (with 1.6 million just in the past eight months). That leaves 15.6 million outside any official consideration, including, it seems, monetary policy that suggests “full employment” where somehow these 15 or 16 million people just don’t matter.
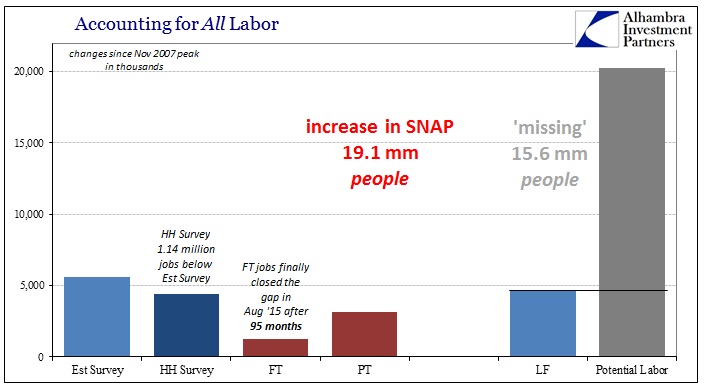
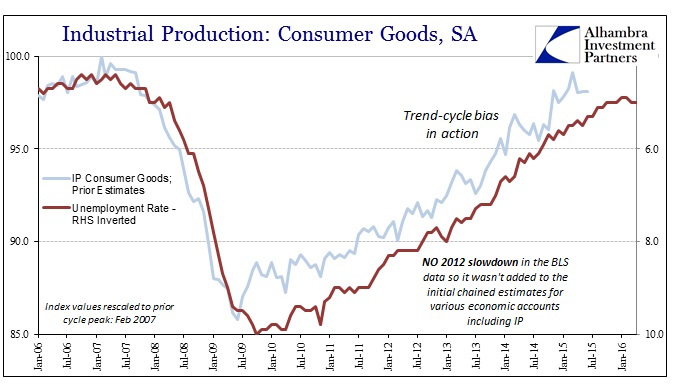
Not all of those potential laborers would have actually added themselves to the labor force had this been a typical cycle, but the point stands as to the dramatic and shocking decline in labor utilization. Economists have ignored this because they assume the data is correct in all its forms; from the actual construction of the monthly chained variation to the criteria used to estimate the size of the labor force. Economic evidence, especially with more complete data through the 2012 Economic Census, falls on the side of common sense – you cannot ignore 12 million (assuming a pre-bubble participation rate) to 16 million people in missing labor.
That is why these more recent benchmark revisions are now following the participation rate rather than the unemployment rate in finding no “recovery.” It further raises the issue about the Establishment Survey itself and especially how it has been so impervious to revision throughout this unique economic condition (stretching now at least four years). The BLS continues to calculate these payroll figures that make no sense and are corroborated by nothing. At best, again, we can only find agreement with the general direction over the past year or so.
Where several monthly reports have been “perfect” recently, this one has to be their opposite. Without the ability to over-emphasize positive monthly variation, all the rest of the economic and statistical problems are highlighted.

