
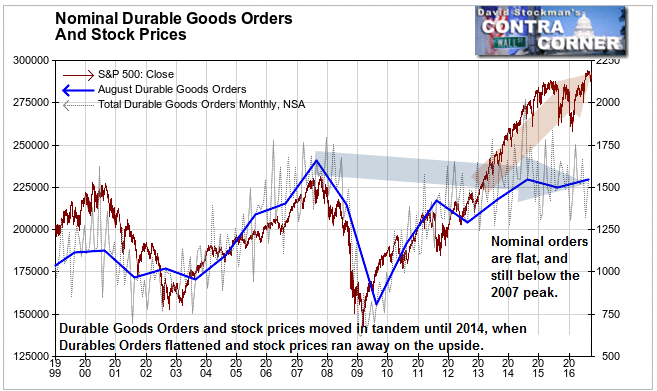
“U.S. factories reported flat demand for big-ticket goods in August, suggesting the economy continues to be restrained by sluggish business spending,” reported The Wall Street Journal. They got that right (for a change)! In the stock market game of pin the tail on the number, the Journal pointed out that the economists it surveyed had, on balance, expected a drop of 1.5% in the seasonally adjusted headline fiction. The report noted some softness on a year to year basis, but did not look at the long term trend, nor how the numbers relate to stock prices. That’s where we come in, because the numbers are meaningless without this perspective.
Here’s what we see. Something is terribly wrong, both with the trend of durable goods orders and with how stock prices relate to that trend. Beneath the “better than expected” numbers, lies an ugly reality.
The most basic problem with durable goods orders is that they are reported by the Commerce Department and regurgitated by the mainstream media on a nominal basis, not adjusted for inflation. That makes them look better than they actually are.
As uninspiring as that performance is, it gets uglier. Adjusting the data for inflation gives us a picture of the actual unit volume of new orders.
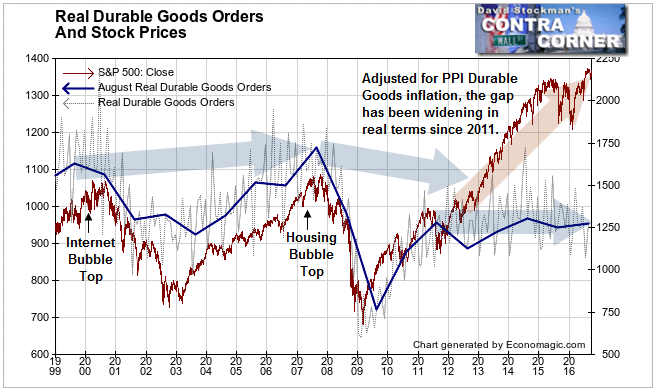
Real durable goods orders managed to eke out a new high associated with the housing bubble top in 2006-07. The peak of orders was actually a year after housing prices had peaked, and almost 2 years after housing sales volume peaked. Both the stock market and durable goods buyers were late in coming to the realization that the party had ended. Nevertheless, durable goods orders did edge to a new high along with stock prices. That’s an important point. The stock market and buyers of durable goods are unlikely to recognize the problems before it’s too late, that is before the problems actually impact their ability to spend.
After the housing crash, both stocks and durable goods orders recovered in tandem, and in proportion with past norms, until 2011. In 2012 they began to decouple. Durable goods manufacturing resumed a secular decline but stock prices continued rising. This divergence represents not only the deindustrialization of the US, but also the inflation of the financialization bubble driven by QE and ZIRP.
Since 2014, the divergence has only gotten worse, even as the Fed pulled back from QE but kept ZIRP in place. In that year the ECB began to exacerbate the problem, and the BoE followed in 2015, instituting NIRP, and increasing their own QE programs. Capital has gushed out of Europe and Japan into the US in search of yield, and the illusion of growth and safety. Financial asset prices became unhinged from reality. Nothing illustrates that more clearly than the massive and growing divergence between this measure of stuff that the US actually produces, and stock prices. Demand for US manufactured goods essentially stopped growing in 2011 while stock prices went to the moon.
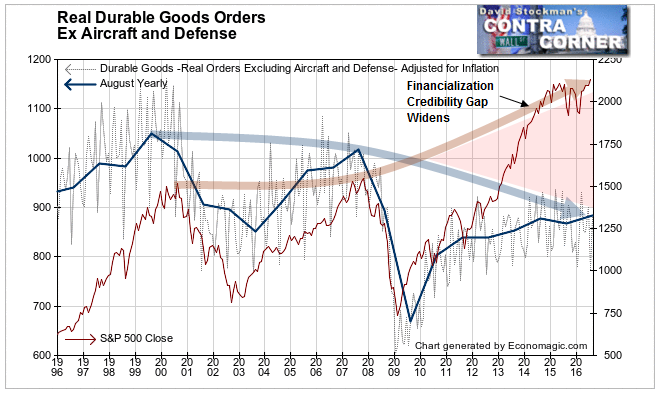
The picture is even more depressing when orders for aircraft and defense related durable goods are removed. The result is a measure of consumer and business capital goods production in the US. It’s clear that we stopped partying like it’s 1999 in 1999. This measure has been sinking since then, and at an accelerating rate since 2007.
Back in the 1960s journalists developed a term for the gap between what the Johnson Administration told us about the Viet Nam War, and the truth about how bad it really was. They called it the “Credibility Gap.” Today that’s an apt description of the gap between what the stock market and its media and government cheerleaders tell us about the US economy, and reality. We face a chaotic withdrawal from the fantasy. A day of reckoning is coming.
Lee Adler first reported in 2002 that Fed actions were driving US stock prices. He has tracked and reported on that relationship for his subscribers ever since. Try Lee’s groundbreaking reports on the Fed and the forces that drive Macro Liquidity for 3 months risk free, with a full money back guarantee.

