By Tyler Durden at ZeroHedge
Last night, following 15 consecutive weeks of client selling, we asked – rhetorically – if today the selling by BofA’s smart money clients would stretch to a new record 16 consecutive weeks.
Will it be a record 16 consecutive weeks of smart money outflows? Find out tomorrow
— zerohedge (@zerohedge) May 17, 2016
Earlier today we received the BofA update, as well as the answer: a resounding yes.
Here is BofA:
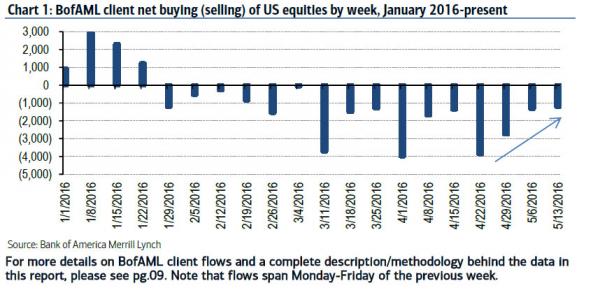
Last week, during which the S&P 500 fell 0.5%, BofAML clients were net sellers of US stocks for the 16th consecutive week—continuing the longest uninterrupted selling streak in our data history (since ’08).
There was some good news: the magnitude of outflows has been lessening for the past three weeks, with last week’s $1.2bn in net sales the smallest in ten weeks. Then again, the selling had declined on 5 previous occasions in the past 4 months and never actually broke to the positive.
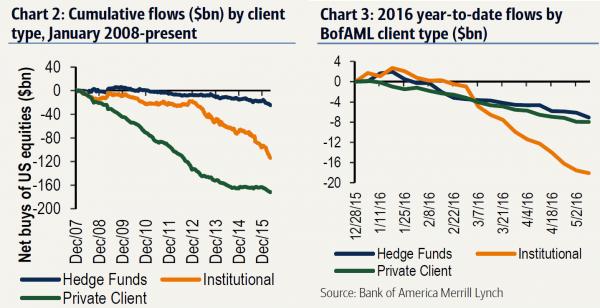
Net sales were led by hedge funds, a reversal from institutional client-led selling in the prior nine weeks. As we speculated last month, we wonder how much of this is forced selling as a result of inbound and rising redemption requests. If that is the case, it sets up hedge funds for an unpleasant feedback loop where more redemptions force lower prices, leading to more redemptions and so on.
BofA continues:
Institutional and private clients were still sellers as well, but sales by these groups were both their smallest since Feb. Net sales were entirely in large caps last week, as both small and mid-caps saw net buying. Buybacks by our corporate clients decelerated last week, and month-to-date are tracking below typical May levels. Year-to-date, buybacks are tracking slightly above 2015 levels but below 2014 levels.
What did the smart money sell (and in some cases buy)?
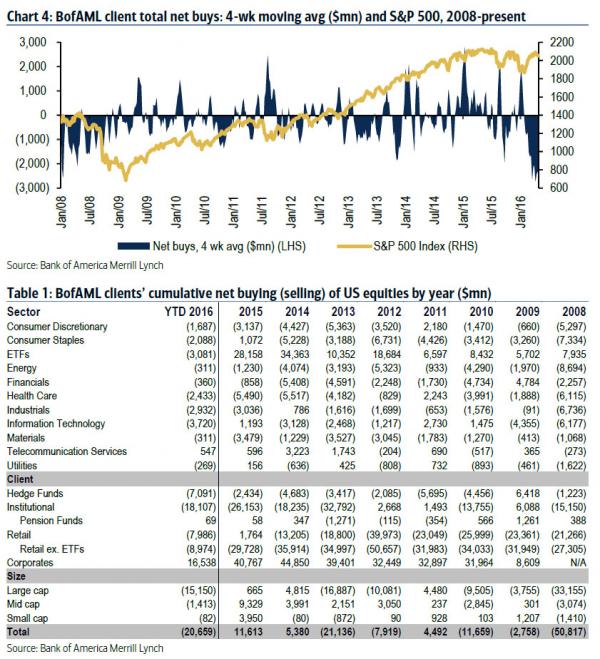
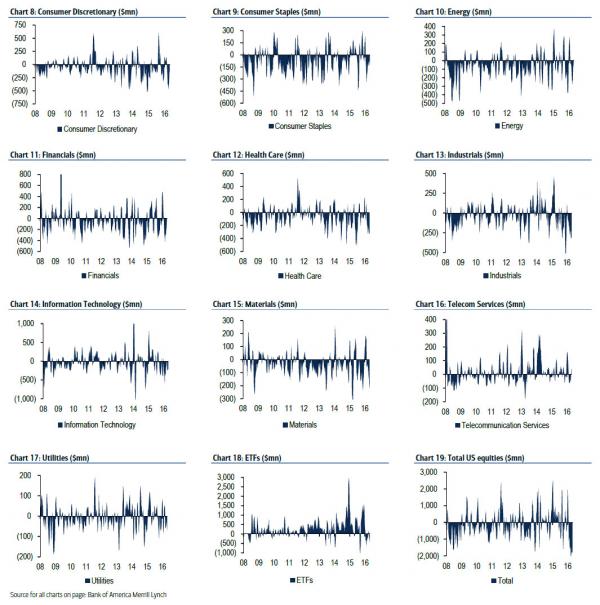
Net sales were led by Consumer Discretionary stocks, where misses from several retailers caused a sell-off in the sector last week. Health Care saw the next-largest outflows; this sector continues to have the longest selling streak at eleven consecutive weeks, hurt by a positioning unwind and political uncertainty in an election year Financials and Telecom stocks, plus ETFs, saw net buying last week; Telecom has the longest buying streak of any sector at three consecutive weeks (and is the only sector which has seen cumulative inflows year-to-date). Based on four-week average trends, where flows are less volatile, in addition to Telecom, Energy is now also seeing net buying after clients had sold this sector since late February.
Next, the rolling 4 week average trends by sector:
- Net buying: Telecom since late April
- Net selling: Tech since late Jan.; Staples since early Feb.; Industrials since mid-Feb.; Financials since late Feb; Materials and Health Care since mid-March; Consumer Discretionary since late March, Utilities since early April, ETFs since late April.
- Notable changes in trends: Energy saw a reversal to net buying after net sales since late Feb.
Finally, on the topic of slowing down corporate buybacks, BofA confirms this.
The four-week average trend for buybacks by corporate clients suggests a bigger seasonal slowdown in buybacks than what we have seen the last few years at this time.
Now that even buybacks are slowing down, just who is it that is offsetting the relentless selling by not only the smart money, but also retail investors which as we showed last week sold the most US stocks in the past month since the August 2011 US downgrade?
Source: The “Longest Uninterrupted Smart Money Selling Streak in History” Extends to 16 Weeks – ZeroHedge


