
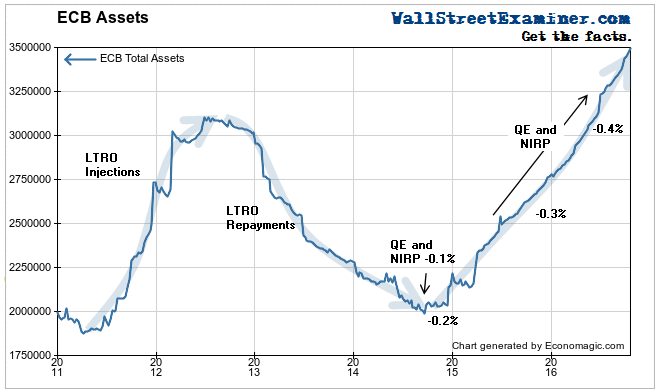
In Part 1 of this report you saw the rollercoaster shape of the European Central Bank balance sheet. The ECB’s assets grew massively under the long term loan program known as LTRO in 2011 and 2012. Then the central bank’s assets fell just as massively when the ECB allowed those loans to be repaid.
Under increasing pressure to stimulate the European economy, the bank instituted a new program of Quantitative Easing, or QE, in mid 2014.
The purpose of QE is to add money to the banks and the financial markets. Central bankers believe that will help to stabilize the financial system, inflate stock prices, lower short term and long term interest rates, and thereby stimulate the economy.
Under QE, the ECB goes into the market and buys bonds, paying cash into the accounts of the dealers and banks from whom the ECB buys the bonds. The dealers and banks then use that cash to buy more securities. Their demand lifts the prices of stocks and bonds. It’s pretty straightforward.
The cash then circulates through the financial markets and economy (mostly the financial markets), but that’s a subject for another discussion. Here we’re concerned strictly with what happens in the financial markets.
When the ECB started the new QE program in 2014, the ECB’s assets began to increase, and even accelerate in 2015 and 2016. The word “soaring” is often used to describe the total asset holdings of the world’s major central banks. In this case the word is an apt descriptor. I would also use it to describe the curve of Mario Draghi’s madness, but we’re not here to discuss central banker personality disorder. We’re here to discuss the impact of the ECB’s actions on the amount of money in the world, and the impact that has on the US stock and bond markets.
At some point the pool of money that the ECB has been growing with QE has become increasingly nutrient poor. When the ECB started QE it also began a counterproductive policy which it called a “negative deposit rate.” It’s also known as negative interest rate policy, or NIRP, for short. NIRP causes big problems for the banks, problems which I immediately foresaw and wrote about in 2014 when the policy was announced. In short, the money that the ECB creates with QE, it ultimately destroys with NIRP.
NIRP is complicated, and we’ll go into it more deeply in the future. In essence, the ECB now charges the European banks interest on the deposits the banks hold at the ECB.
Banks hold deposits at the central bank, just like we ordinary people do at our local neighbor “too big to fail” bank. The problem for the European banks as a whole is that they can’t just easily withdraw the money from the ECB like we can from our bank accounts. If our banks start charging us interest on our deposits, when the charge gets painful enough we’ll just take the money home and stash it in the freezer. There’s nothing like having a little cold cash around. Banks can’t really do that. Their vaults aren’t big enough.
When the ECB buys bonds from the banks in executing QE, it pays for them by electronically debiting the bank’s deposit account at the ECB. Those deposit accounts are known as “reserves” or “bank reserves.” When payments flow from bank to bank in the real world, the reserves flow from bank to bank on the ECB’s balance sheet, but they don’t leave the central bank balance sheet. In total those reserves don’t leave those accounts. Some, if not most banks are always incurring that negative deposit rate.
Suffice to say that charging interest on reserve deposits gives the banks an incentive not to hold those deposits. So they find ways to extinguish or get rid of those deposits. One way is to use their cash on deposit to pay down loans. Other, private borrowers who may be holding negative yielding sovereign debt, are also driven to use their cash to pay down loans. Those actions remove money from the banking system.
Think of paying off your credit card balance. You pay the bill and the debt disappears. And so does the cash from your bank account. When you use the money to repay a debt, it simply ceases to exist. Poof. If everybody paid off their credit card balances at once, the system would almost certainly collapse. The same goes for the banks. When they pay down debt, their deposits at the ECB shrink. The more aggressive they are in doing that, the greater the systemic risk.
In 2014 I foresaw that this would happen. It subsequently came to pass, and the problem is getting worse.
In Part 1 of this report I showed you a chart of the ECBs total assets as the central bank went from the LTRO lending program to those loans being repaid in the space of 3 years. The LTRO program was just one of the ECB’s fiascos. The chart then showed the ECB assets beginning to grow again when the ECB started QE, and growing even faster now, following the ECB’s increase in its monthly purchases earlier this year. Here it is.
Now let’s overlay a chart of deposits on the graph of the ECB balance sheet. Look what happened as NIRP was introduced. NIRP has put a noose around the necks of the European banks. As the NIRP rate has been made more negative, that noose has been tightened. Instead of money getting easier as the ECB wanted and expected, liquidity has tightened.
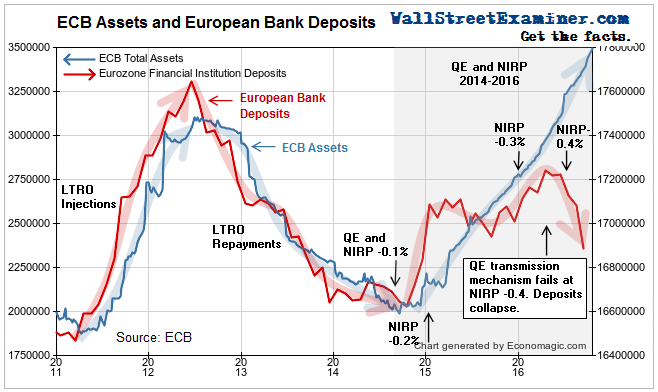
You see in the first half of the chart that deposits in Europe’s banks grew and shrank with the ECB assets tick for tick. That’s the way it’s supposed to work.
When the ECB instituted QE and NIRP in mid 2014, the new policy also started out working the way it was supposed to. The ECB pumped and banking system deposits grew. But in early 2015 the rumors started to fly that Mario Draghi, the Grand Wizard of doing whatever it takes,” would go even more negative on NIRP. That made the banks nervous. They started looking for ways to actively shrink their deposit bases.
Remember, when a central bank buys bonds from a bank in the pursuit of QE, it pays for the bonds by debiting the bank’s deposit account at the ECB. That sale then starts costing the bank interest day after day because it is on deposit at the ECB. At 0.1% or even 0.2% the banks didn’t mind too much. But when they heard that the rate was going to -0.3% they wanted to start getting rid of those deposits.
At -0.4%, deposits in the European banks began to crash, threatening the worldwide pool of liquidity with outright contraction. If this isn’t reversed soon, the trend will begin to feed on itself. Banks will begin to deleverage more aggressively. They will sell assets to achieve that. That selling will bring enormous pressure to world markets. Securities prices will fall. Margin calls will go out, and so on. The US will not be immune. In fact, it will be directly affected.
In tomorrow’s final installment in this series, I’ll explain how the shrinkage of European banks will impact the US markets, and I’ll show you what I think is the most important chart in the world right now.
Lee Adler first reported in 2002 that Fed actions were driving US stock prices. He has tracked and reported on that relationship for his subscribers ever since. Try Lee’s groundbreaking reports on the Fed and the forces that drive Macro Liquidity for 3 months risk free, with a full money back guarantee.

