
According to the BLS, this has been the best jobs market in decades going back over a year now. After revisions, you can extend that narrative even into 2013 where it seems like QE3 and QE4 had a major impact on employment. That was the reason that Ben Bernanke appealed so curiously direct toward the unemployment rate in his defense of his own record, but all that measures is the raw count of the number of payrolls (setting aside those who aren’t looking for work any longer). For the past several years as the jobs market purportedly streaks ahead, the divergence with spending, for example, has grown quite severe.
That raises the basic question about just what kind of payroll expansion is taking place, or even whether it is taking place at all. It is not just spending that calls into question the assumed amount of labor expansion via the Establishment Survey, as the BLS’ productivity figures might be an even larger thorn in the side of those that wish to see recovery through the unemployment rate.
Part of that line of inquiry runs through what the Establishment Survey itself actually measures, and it is not the amount of payrolls. The month-to-month changes are chained variations around an assumed benchmark, one that is set mostly by trend-cycle estimates. I have covered this assumption before, looking at the relationship of jobless claims as it may pertain to setting the trend-cycle component for the Establishment Survey. Productivity, however, comes at this from a different angle, as it attempts to bridge this divide between what the BLS calculates, stochastically, of employment and what the BEA figures for output.
Those two data systems should be quite relative as under a monetary economic existence it is employment, labor specialization specifically, that denotes economic progress. Therefore it makes sense that the raw count of employment expansion would meet the dollar figure of output. This relationship does not have to be strict, but there is a reasonable expectation for at least resemblance.
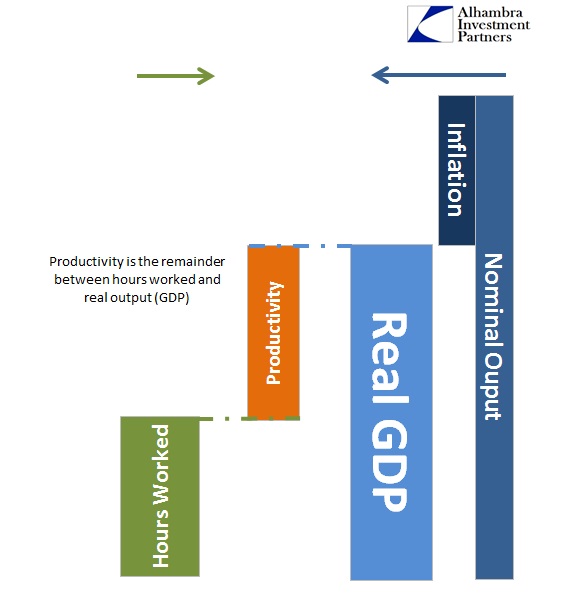
Productivity is that resemblance, as it sits as a leftover computation between these two separate views on the economy. The BLS takes a pared back version of GDP, a measure strictly of “private output”, and subtracts off its own estimate of total hours worked – the remainder as productivity. There are, of course, other factors involved here, most especially inflation, but in this view I want to focus on and isolate the productivity part to gain a sense of how much the BLS’ calculations for employment are perhaps way, way overdone.
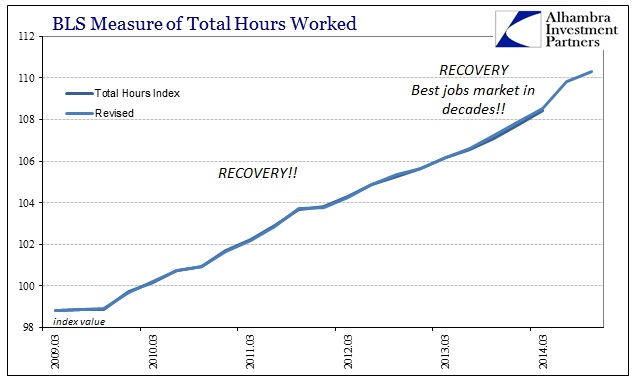
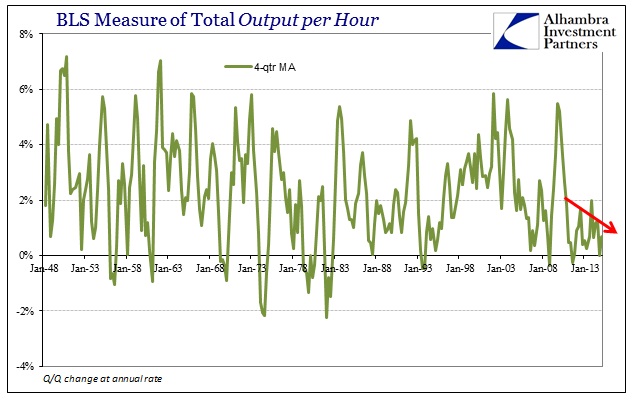
If we start on the left side, hours worked, the past few years have worked their way into the monetarist view of QE being highly effective toward at least employment. There is not just an upward slope in labor utilization, it has gained even more elevation in the past year or so regardless of the more violent swings in GDP and other economic accounts that are more questioning.
But that narrow view is already highly deceptive as it does not take account of the full “cycle” peak to peak (which is how these sorts of things should properly be measured). It is here that the recovery turns far more like Depression.
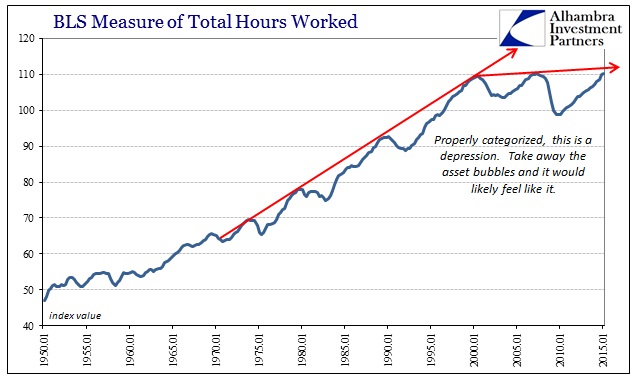
This is a run of futility that stretches back for now almost fifteen full years. The only time in modern history (and even all American economic history for even the 19th century where partial estimates exist) with such labor ineffectuality is the Great Depression. And this bubble period shares a great deal of similarity and similarities with the 1930’s especially in employment and labor utilization.
The Great Depression itself was marked by two separate “cycles” both of which had the effect of remaking the economy into something far smaller by the ends.

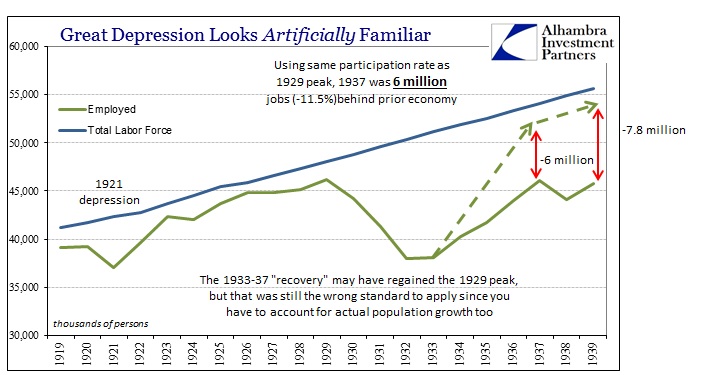
Again, we see the now-all-too-familiar “participation” problem, only in the 1930’s you were counted as either employed or not; and if not you were still part of the labor force. The magnitude is certainly greater then, but the pattern is unmistakable in both.
Because there were separate cycles contained within the larger depression cycle, conventional “wisdom” about recoveries and such were misleading. While employment was gaining prior to 1937, and then after 1938, that wasn’t the same as an actual recovery which restored the prior economic trend – the definition of recovery. Despite the preponderance of positive numbers and calculations, these patterns were entirely distinct from actual recovery which proves “something” very depressive in the governing dynamics that indicates much more than cyclical dislocations here and there.
We see exactly that as it relates to first the dot-com recession and recovery (which did not restore the pre-2000 trend) and then after the Great Recession which was even worse. The net effect of both greater depression cycles is to leave a smaller economy at the ends than at the inaugural peaks – a fact further emphasized when taking account of population growth.
That immediately questions the very idea of the “best payroll expansion in decades” as it would by highly inconsistent to have that alongside continued depression pressures. Economists may argue (assuming they would ever accept the reality of depression in labor currently) that the more recent, post-QE labor gains are the economy finally breaking free and out of those depression forces, but the fact that there has been no spending gains (or even commensurate GDP gains) suggests more the statistical mirage. That is also what productivity is projecting.
It has become somewhat of a mystery for orthodox economists as US economic productivity has fallen off especially after the 2012 slowdown (which isn’t ever recognized). The mainstream interpretation of that, to be consistent with the Establishment Survey, is that businesses are hiring but not getting much profit out of doing so. That just doesn’t make sense.
Conceptually, there is a good deal of sense in putting these figures together in this manner. Businesses do not actually calculate productivity like this, but it certainly is a major factor in how businesses view their own cost structure and especially ideas about expansion (true economic growth). Low productivity would not be so favorable toward expansion and usually ends up leading into recession as businesses struggle then with profit considerations. At the other end, recoveries are born where businesses are able to cut labor costs faster than output (revenue) is falling.
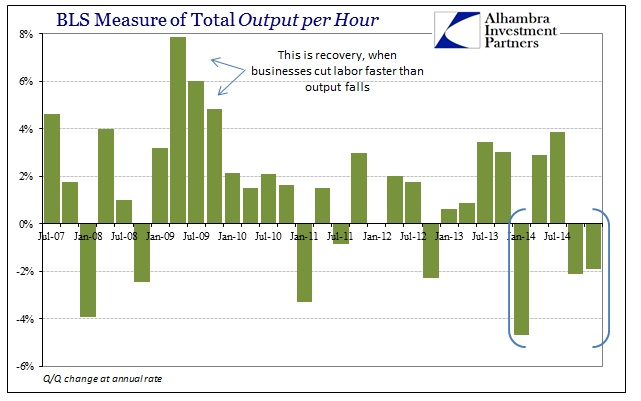
So three out of the past five quarters have shown rather deeply negative productivity, an unusual occurrence that has not been seen since the Great Inflation. For the two most recent quarters, this rarity is revealed as that large inequity between labor estimates and output.
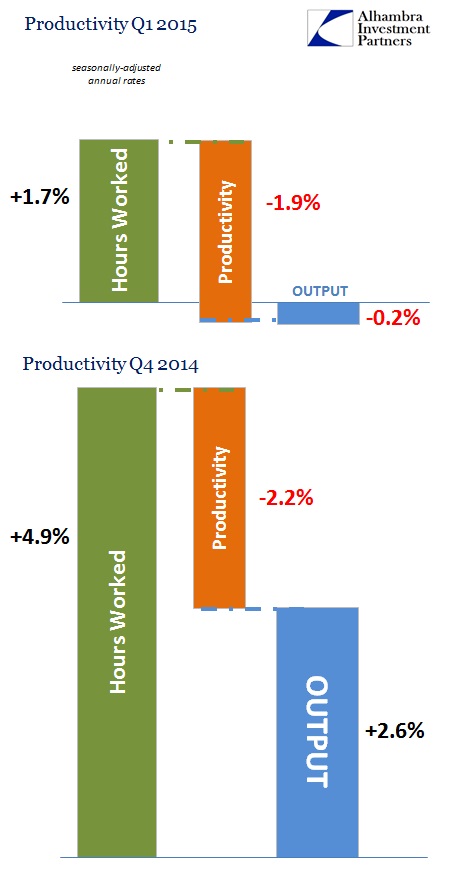
The problem is really sharpened with Q4 2014, where we are supposed to believe that businesses were hiring at exceptional rates, leading to almost a 5% increase in labor hours, but output was only slightly more than half of that. By the nature of productivity calculation, the result was -2.2%. For Q1, output was slightly negative but business still expanded, rather robustly, labor hours?
And it isn’t just these two most recent quarters, as you can go back and survey an average of the past five (which includes two bad quarters, two very good quarters and one in between) which shows this same incongruence, assaulting basic common sense.
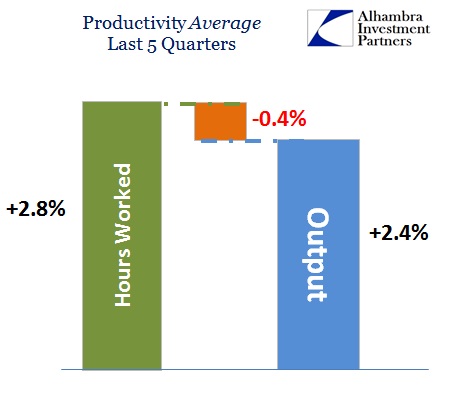
A five-quarter negative productivity results as businesses supposedly hire more workers and worked their existing staff more than output grew. I think what becomes clear by devolving through these calculations is that the BLS’ measure of employment does not sync with the BEA’s weaker measure of output. Rather than revise one or the other, productivity is turned negative (as the remainder) to preserve both figures, and thus leaves this orthodox quandry. Output cannot be revised upward because calculated “inflation” in 2014 and 2015 is already low to the point of being almost zero. That, then, further suggests that it is labor calculations that are far too robust.
If we substitute the productivity rate average from 2004-07, changing the plug variable instead to hours, this problem is revealed as quite large.
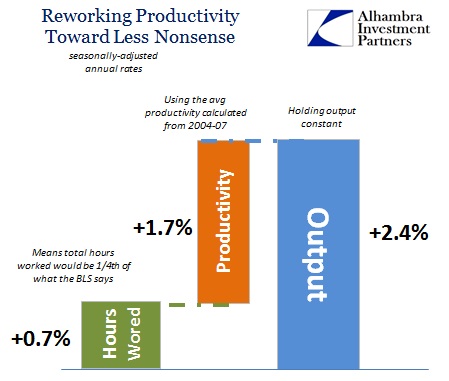
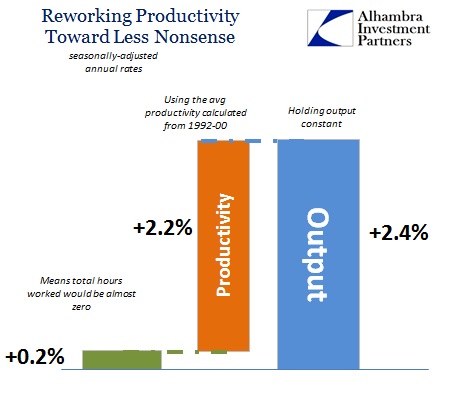
With a more “normal” or consistent productivity picture, total hours worked would have gained only a quarter of what the BLS says, puncturing permanently the idea of the “best payroll expansion in decades.” And that is being conservative, as productivity historically has been much better. Using the productivity plug that averaged from 1992 to 2000 would yield about zero labor gains in the past five quarters:
The only way to keep that recovery narrative alive through the Establishment Survey and unemployment rate is to chop off productivity to the point that it doesn’t make any real sense. In other words, the BLS’ very own calculation setup reveals the weakness in their trend-cycle estimates. There is a high degree of mismatch between what the labor portion is describing and what the rest of the economy is doing. That was already a problem in the wider view of this 15-year, ongoing depression in labor, but is far more consistent if productivity is not “allowed” to be so butchered by the preferred payroll view.
This is not to say that all the above calculations are accurate depictions of what “should” be; rather this is only illustrating the very high likelihood that the Establishment Survey is way off. If productivity in reality was even half of what it had been, the labor market would show up as far more lackluster and far less confirming of the “gaining” recovery. The fact that this discrepancy is so large almost totally precludes any other interpretation than the BLS being over-eager in its benchmark settings.
As much as the continued spending deficiency is enough of a challenge to the dominant labor doctrine of 2014-15, productivity should be quite dispositive of its nonsense. The BLS is extrapolating a trend-cycle approach that just doesn’t exist, and its own reconciliation with BEA output estimates proves that. Either businesses are totally indifferent to their cost structure in the past few years, a total and sudden departure to how businesses have operated since businesses started operating, or the payroll gains are nothing more than illusive fantasy. That final interpretation is far, far more consistent with the world around us, including calculations of pretty much everything else besides payrolls. If QE stimulated much of anything, it was perhaps limited to just the very subjective assumptions of the statisticians within the BLS.

