There weren’t any surprises in the “final” GDP update for Q1. Going back to -0.2%, the same interpretations still apply, especially and including the inventory contribution. Economists and policymakers want to talk particularly about how Q1 is prone to “residual seasonality” but that is missing the bigger part of the problem. Whether Q1 was -0.2% or +2% doesn’t really matter, as what truly makes this a dangerous economic situation is that Q1 and all the prior quarters were not a steady +4%.
To listen to economists today is to suggest that such an expectation amounts to wishful thinking, and that such “normal” growth is no longer. That sentiment may apply, but only to the narrow manner in which orthodox economics can integrate real world factors. In other words, “they” accept that there is something wrong but cannot answer the relevant and primary question as to what that might be.
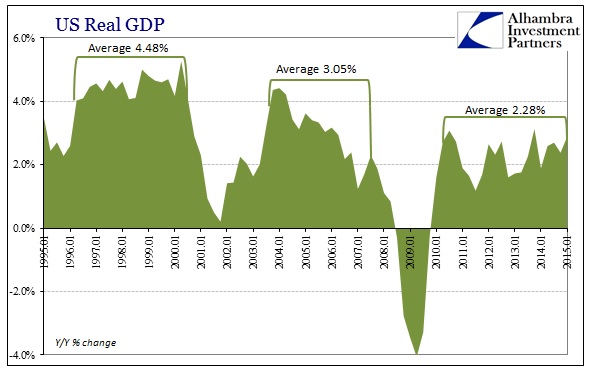
This problem is obvious in every economic account, including GDP. Using year-over-year figures to harmonize among other economic systems, the lack of growth is striking post-crisis – made all the more so by the size of the huge hole left in the wake of the Great Recession itself. That means, even by this count, the opportunity cost of this non-recovery is severely understated.
I picked 1995 as a starting point for a reason, which I’ll get back to below. Suffice to say, in isolating only the growth periods of each economic cycle the current version is by comparison about half that of the late 1990’s. The middle cycle, the housing bubble age, shows what is plainly a transition from the first to the third. The primary opportunity cost is not simply the difference between them, but rather far more importantly the compounding nature of time. In other words, the longer these deficiencies drag the more costly in very real economic distortions that cannot be measured.
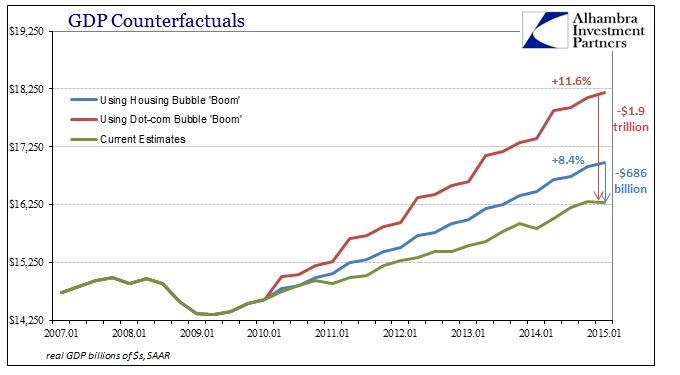
We can try to do so, but the intangible portions of this kind of negative reality are difficult if not impossible to quantify – the further you stray from the efficient path, the more trouble you incur (geometrically) when you realize the error and attempt to strike back toward the “optimal.” In the counterfactual example above, I have plotted GDP as it is currently estimated (green line); what it “would” be if the housing bubble cycle average had been repeated (blue line); and, what it “would” be if the dot-com bubble cycle had returned. The disparities are enormous, and demonstrate quite well the effects of lost compounding – the difference between current GDP and the dot-com example is nearly $2 trillion!
These are not just unrealistic numbers on an unrelated chart, as those upper trends are exactly what businesses and people are and have been expecting all along. That disparity was sharpened by each of the successive QE’s and promises about ZIRP, as they were explicitly tailored and proclaimed to deliver something like the red line, not the blue, and certainly nothing near the green. Businesses have planned and acted on that expectations for that success as monetarism somehow made it through 2008 largely unscathed if somewhat dented in public opinion (mostly because 2008 remains hidden, especially under cover of “it would have been worse”). I have little doubt that is a big reason why the economy exhibits an almost stop-go pattern, centered on each of the QE’s (not the weather).
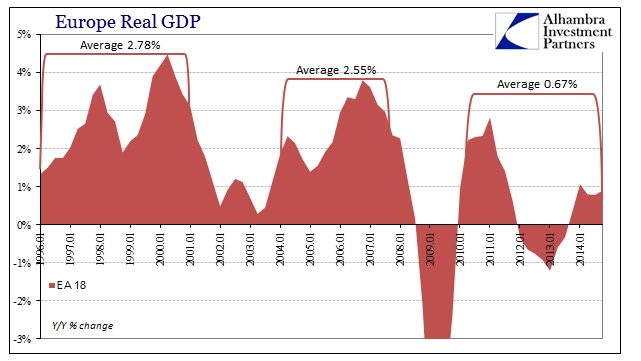
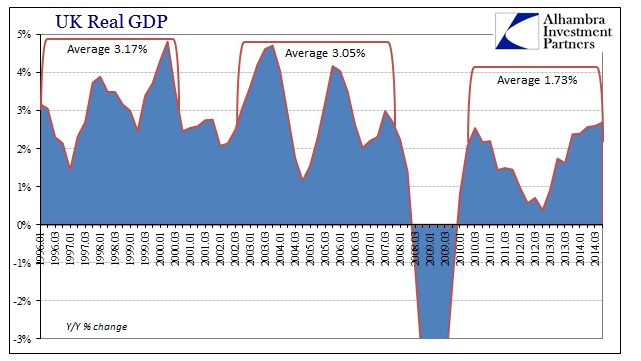
What is truly extraordinary, however, is not just the US deficiency but how that same pattern or idea has been clearly transported nearly everywhere around the globe.
GDP volatility from quarter to quarter remains constant, but the baseline upon which that volatility pivots has shifted dramatically lower. It started somewhat, like the US, in the middle cycle period but has attained an enormous depression in this third cycle. Again, that would be a huge problem itself if not for the massive decline of the global Great Recession which means the largely positive numbers that have followed it are even more uninspiring than they first appear.
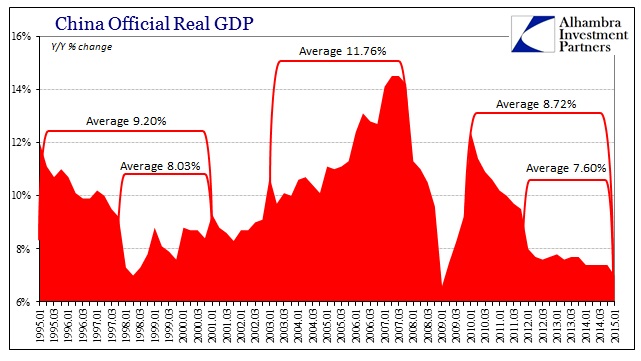
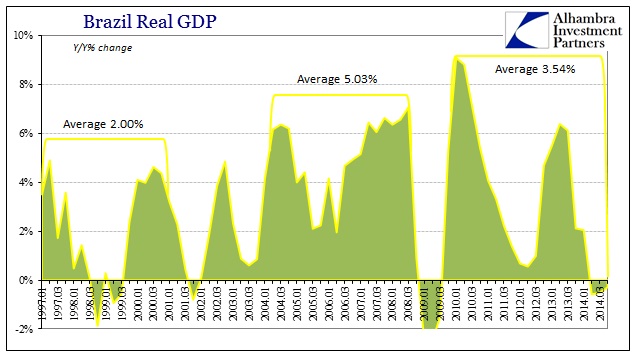
When switching to the “developing” world, though, the middle cycle turns upward as a clear surge beyond either the first or the third. Not surprisingly, that penetrates not just China but relatedly Brazil (and other “resource” nations I won’t present here).
And so we can start to appreciate the nature of the serial asset bubble economy as it existed globally. In the first age, the dot-coms’ (US terminology, to be sure, but it fits the rest of the world at least loosely) economy was driven the combined impact of the start of housing imbalances as well as a flood of stock-based “money” which heavily influenced, artificially, capital spending. Those two bubble basis effects combined enough to draw in and begin to orient global economic factors toward them.
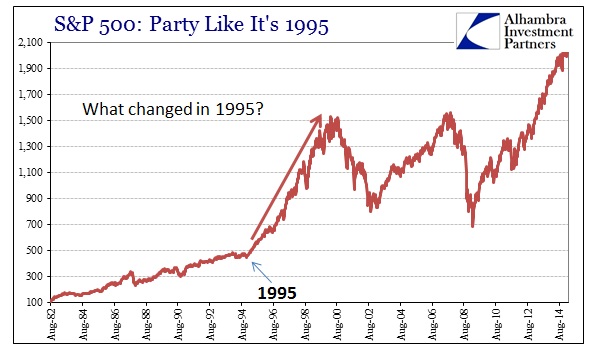
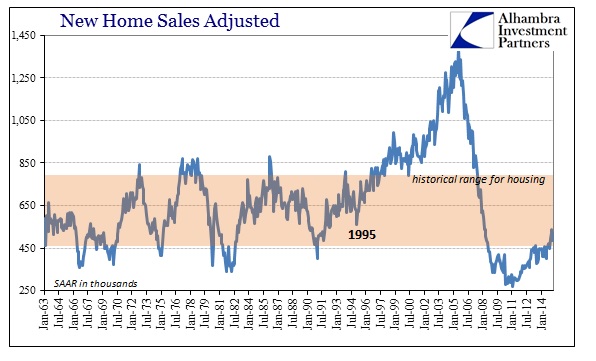
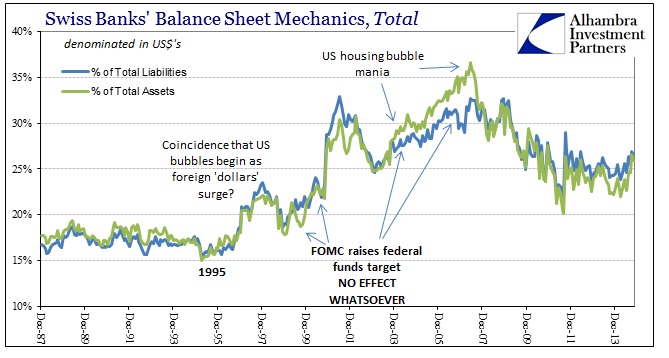
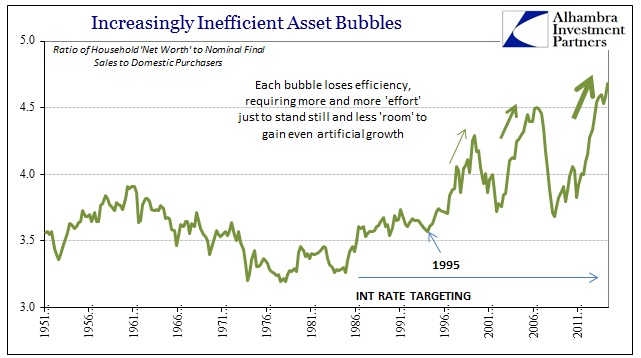
The serial bubble age began in 1995, a fact easily observed by any number of asset bubble indicators – from stocks to housing to even the relative measures for actual economic efficiency drawing from the bubbles as a primary source.
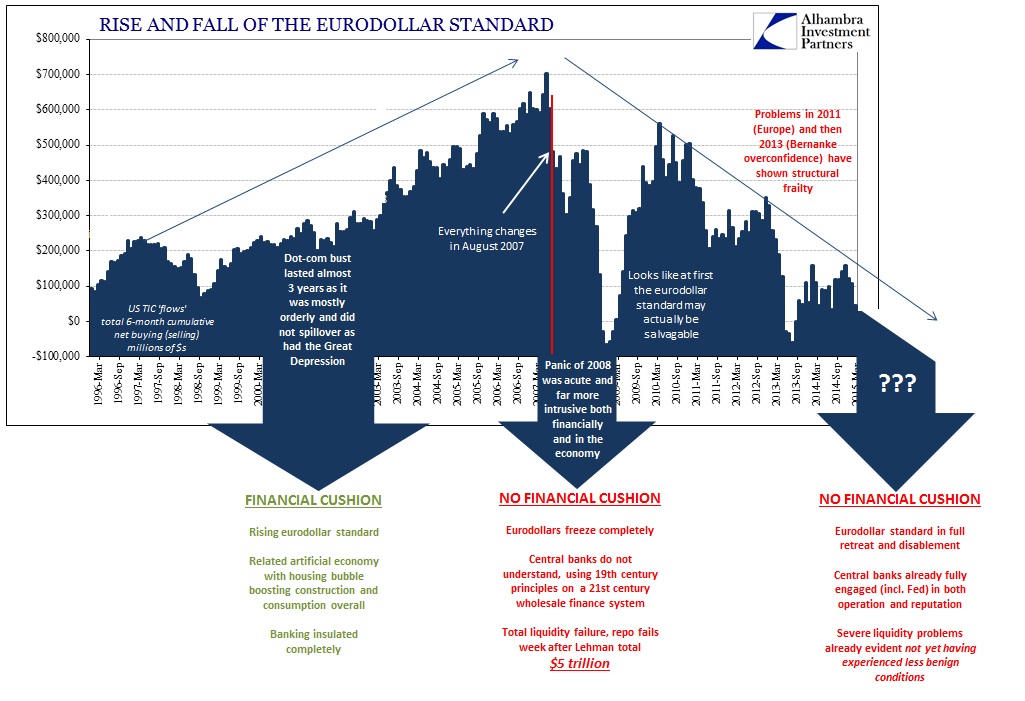
There are a couple reasons as to why 1995 is such a fixture in starting this global reorientation. It was around that point where eurodollar behavior altered enough so that what was left after the end of the gold exchange standard as an almost niche (if still huge) credit market could suddenly become the primary means of speculative expansion inside the US (and around the world). The key mechanical difference in 1995 was VaR, opened up through JP Morgan’s “publishing” its securities database into what would become RiskMetrics (a service rolled out widely to the global banking sector starting in October 1994). It sounds simple and innocuous, but that one change would unleash untold leverage through nothing more than balance sheet mathematics made deliverable by the Basel rules – technology and regulatory short-sightedness combining to define marginal global expansion for, unfortunately, decades.
The difference in GDP among the three cycles is simply the decreasing efficiency each one can/could produce. After the dot-com crash and related recession, the far bigger housing bubble was left more a matter of asset inflation than actual direct economic activity – a highly inefficient transfer of house prices to mortgage credit to home equity as ATM’s (along with a bump in construction).
The primary difference of the second age in the US and Europe to that in China and Brazil was how the housing bubble affected each. It was highly inefficient in the US and Europe to a lesser extent, but to China and the resource supply chain around the world it was the opposite (if still, again, artificial). Since the middle cycle was largely consumption-based, it makes sense that the consumption chain globally would be among the primary responses. In other words, the eurodollar system “produced” the credit expansion, some of which went to fuel asset prices as the basis for consumption in the US and Europe, but a good portion was dedicated by expediency to China, Brazil and the rest in which to service that consumption trend as cheaply as possible.
That is why China is the perfect expression of the upside (and now downside) to the eurodollar system as it advanced through the middle 2000’s.
The lack of growth universally in the third cycle is simply that neither of the temporarily positive effects of the first two were actually transcendent. The US and Europe are stuck without financial “production”, meaning a consumption problem without any leftover and organic productive expansion to fill that hole. That, then, leaves the rest of the world both dangerously waiting for all that to rekindle (since productive power and ability in the second cycle was based on eurodollar leverage – the global dollar short – to begin with) and short of inertial and internal expansion without any of it. The longer this hole has lingered, the more negative self-feeding starts to unwind the financial basis (clearly seen in China’s severe retrenchment).
The post-1995 eurodollar system simply became so inefficient that it was no longer re-workable past the Great Recession itself. The Fed has become so irrelevant, in the real economy, as to be stuck quibbling whether Q1 was slightly negative or slightly positive when the real problem is much more widespread, global even, and far deeper than they certainly appreciate. Trillions upon trillions in “stimulus” and the FOMC is left, pathetically, fighting for the distinction of “it’s not as bad as it looks.” That would seem to make this the most costly economic age ever conceived, with global implications that are just now starting to be felt as whatever faith was leftover from 2008, wrong or right, wears off all over the world. That is a highly combustible deficiency, since the longer the global economy remains disorientated the more likely it is to experience not just recession but, since this is all still so leveraged (even more poorly this time), something potentially worse.

