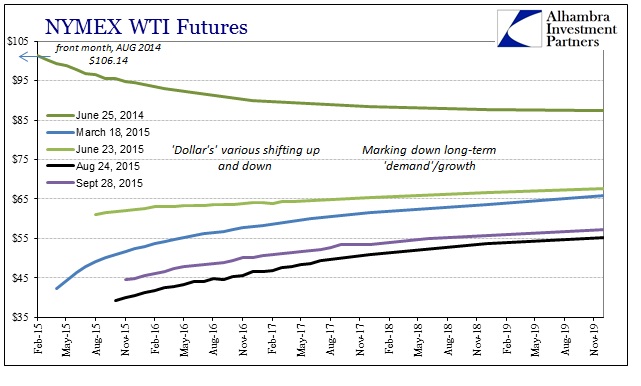
While central banks would prefer to isolate oil prices as if in their own world with nothing at all to do with finance and economy more generally, it is oil prices that continue the disappointment connecting the “dollar” to the growing market (and therefore economic) wreck. Front month and spot crude prices had bounced around more favorably since the August 24 low, but the rest of the curve has been far less responsive. The outer maturities for oil prices remain seriously depressed without any visible means to correct that no matter what Janet Yellen declares about 2% inflation anchors.
With oil liquidating again, the outer end of the futures curve participated as strongly (if not more so: futures price for November delivery was down $1.22 while the December 2017 price was off $1.47; December 2018 -$1.36) as the front, which means again the economic foundation of that part of the curve is more validating of the “dollar” to its downside rather than the rebound since late August.
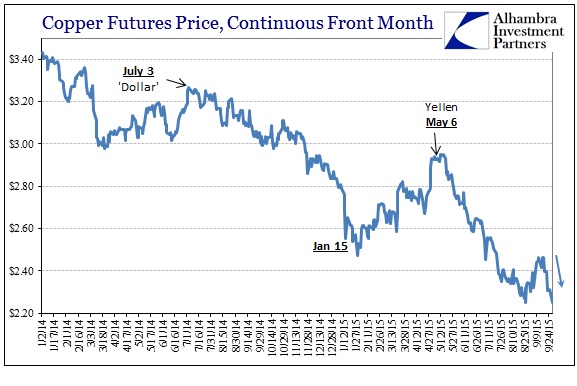
Copper prices in the past week are clearly running in that direction, too. The October futures price settled at $2.251 which actually makes a new multi-year low closing price. The low trade for the day of $2.236 was only pennies above the August 24 extreme.
The fact that commodities (and stocks) have seemingly renounced that post-August hope right at the FOMC’s inaction is unsurprising. The “dollar” in all its various facets was never quite so optimistic in the interim, instead having been pushed to new bearish extremes in the wake of the FOMC confirming what has been growing suspicion in correctly interpreting the “dollar” run; the world is an utter mess, just as the “dollar” has had it. While that was bad enough given last year’s unquestionable economic “boom” projections, this latest “dollar” move suggests that there is not yet sight of the darkest potential.
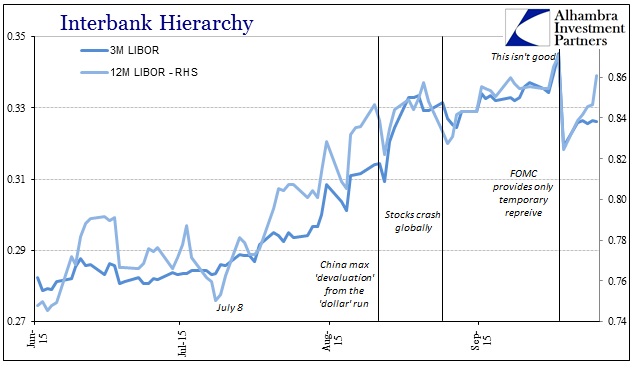
To that end, this week starts out unfortunately with acceleration. As last week, the Asian “dollar” is noticeably absent from the fireworks as SHIBOR continues to be pegged but offshore yuan rates (CNH HIBOR) aren’t too disturbed, either. Instead, eurodollar LIBOR surges back especially at the 12-month maturity. That is problematic on its own but not least of which because last week’s rise destroys the idea that LIBOR has been moving on expectations of monetary policy (if the Fed is “on hold” then LIBOR should be “undoing” at least some of its recent surge, continuing beyond the one-day decline after the FOMC meeting; instead, it has renewed the upward trend not on policy expectations one way or another but rather the continued and confirmed “dollar” disruption).
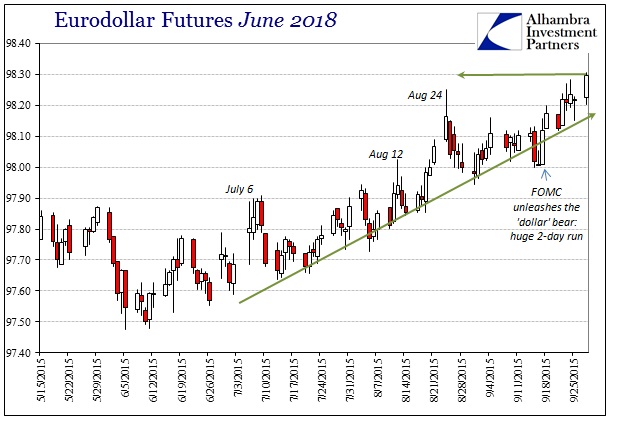
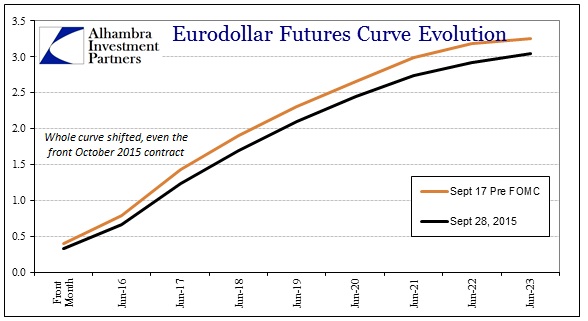
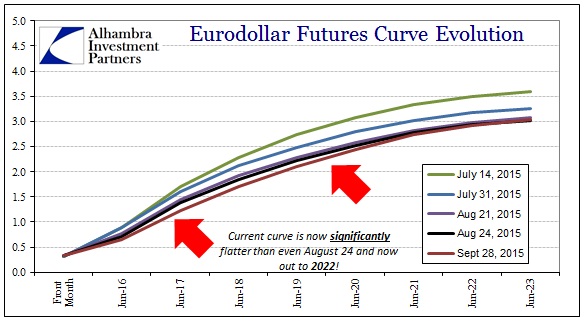
That much we could have surmised from eurodollar futures alone (and especially related swap spreads). The eurodollar curve has no issue with monetary policy, instead being bid in what can only be direct contradiction of everything that central bankers talk about these days (from anchored “inflation” to oil prices being only oil prices to the extended and extensive use of “transitory”). Just since the last FOMC, eurodollar futures significantly extend beyond (in price; below on the curve) August 24.
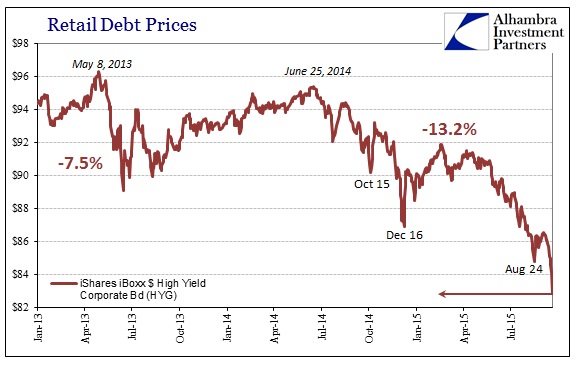
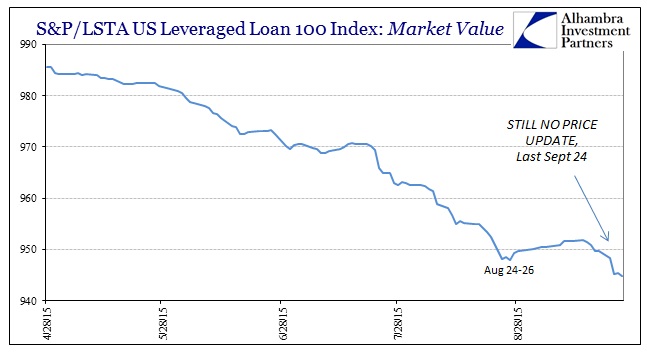
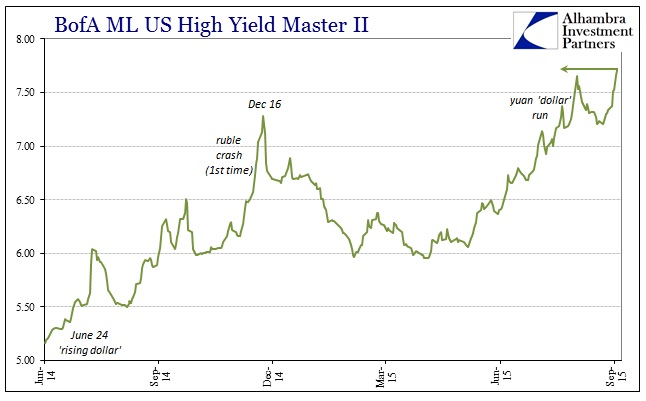
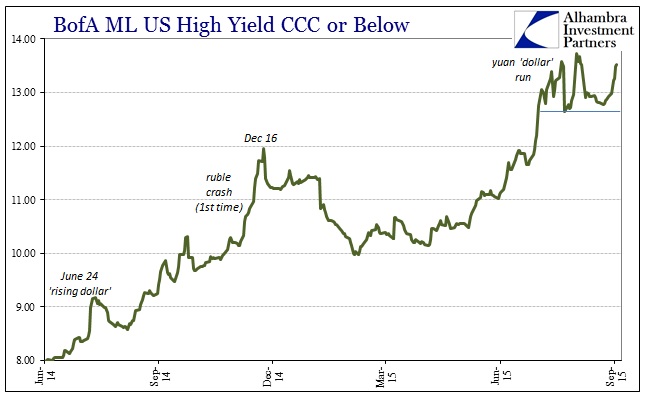
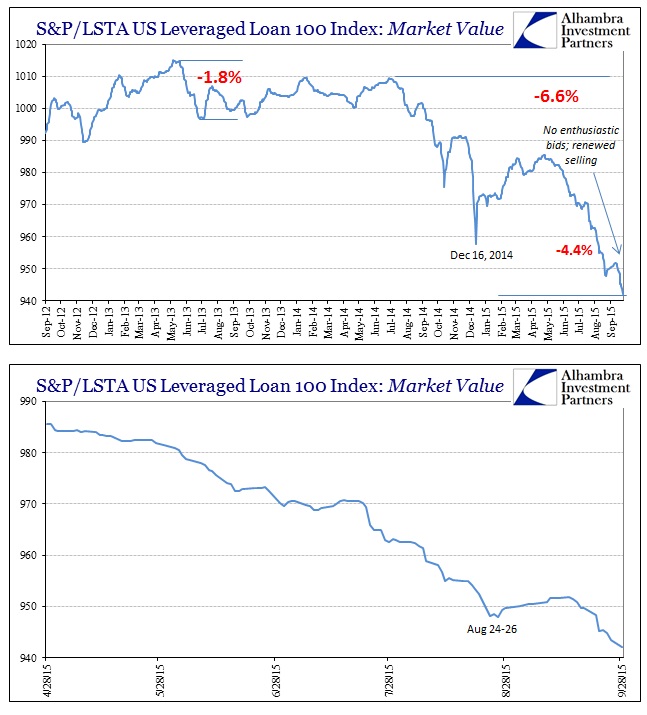
So the broad and “alarming” selloff today is, again, no surprise given that funding background. What is noteworthy about the prices in the corporate bubble is how that is also accelerating on the downside toward whatever breaking point surely awaits. The combination of declining acceptance of the “transitory” central bank fantasy and the reality of the “dollar”, especially broadly in so many negative moves, is a potential avalanche. Junk debt is selling off hard today, though only retail prices will have to suffice in confirming that since leveraged loan prices (the S&P/LSTA index) remain with only sporadic updates (which I believe, to reiterate, can have an even more corrosive effect on position confidence).
Since Janet Yellen’s speech last week was clearly meant to restore calm, we can reasonably conclude that the “dollar” still isn’t listening and, worse, more markets are joining the “dollar” in tuning out the unchanging prattle.
UPDATE: S&P/LSTA Leveraged Loan 100 comes out at 942 and new multi-year low. That isn’t nearly as bad as you would believe given other prices, but then again the leveraged loan index is capturing the best possible view of that space. Less liquid (of less visible names, no less) loan prices are likely faring much worse. For frame of reference, 942 is the same market value as early December 2011, after the last vestiges of the 2011 “dollar” crisis knocked the index back from 960 that November and before the LTRO’s and unlimited, open dollar swaps sent the index surging to 970 by February 2012. In other words, a highly unfavorable comparison.

