The Treasury has built up a big cash balance at its bank, the Fed, but it won’t hang around for long. Turmoil is coming, most likely in October, when the government runs out of pension funds to raid.
Meanwhile, growth rates of key banking indicators have rebounded a bit. One critical indicator that had the biggest crash has had a big rebound. The question now is how much longer these measures can limp along at modest growth rates.
The Fed’s Balance Sheet
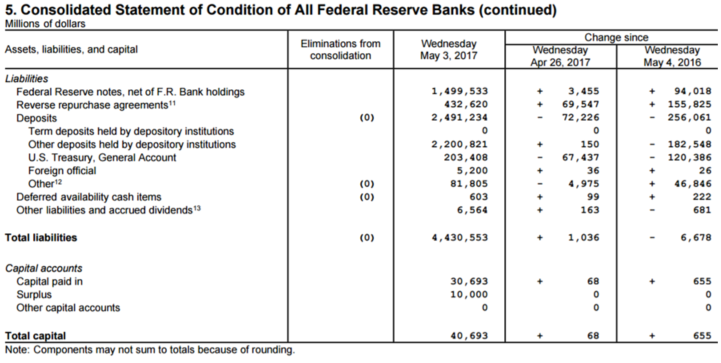
Every Thursday the Fed reports the condition of its balance sheet on a report known as the H41. Over the 4 weeks ended May 4 the Fed’s assets fell by $3.5 billion from minor changes over a number of line items. There was nothing significant on that side of the balance sheet. The Liabilities side was another story.
As of May 3, 2017, the US Treasury’s deposits at the Fed totaled $203.4 billion. This was an increase of $120 billion from 4 weeks before. The gain reflects income taxes collected and processed in the second half of April.

In February and March, Trump spent the $400 billion wad of cash that Obama handed to him on January 20. By March 15, Trump had spent some $380 billion, driving the Treasury account down to $23 billion on March 15. We saw the impact of that spending spree immediately in the stock market, and should see the economic impact in April economic data. We’ve already seen the first of it in the bump in April employment.
The Treasury has been piling up cash again since mid March. 2016 annual corporate income tax underpayments came in on March 15. Then individual taxes for 2016, and both corporate and individual estimated taxes for Q1 2017, came in on April 18.
The government has gained some breathing room versus the debt limit from these receipts, but not much. The Treasury will continue to raid internal accounts such as government pension funds. That game will come to a screeching halt on October 2 when the Federal Government is required to make an annual contribution to the military pension fund. The crunch could come before that if tax receipts recede.
The debt ceiling means that new borrowing will need to stop. The Treasury will need to spend all the cash in the pension funds and other internal accounts as well as its cash account at the Fed without being able to borrow to supplement that cash.
In other Liability line items on the Fed’s weekly H41 report, regular bank reserve deposits, called “Other deposits held by depository institutions” fell by $140 billion in the 4 weeks ended May 4. They supplied all the $120 billion that went into the Treasury over the month.
Where did the other $20 billion go? $8 billion shifted from the reserve deposits to the Fed’s RRP account. It’s a difference in name only. Overnight money is overnight money. RRPs are effectively the same as reserve deposits. But RRPs are not counted in official reserves.
Reserve deposit holders converted $6 billion of their deposits into paper money, now circulating to their drug and contraband dealer customers around the world.
The “Other deposits” line item includes the Primary Dealers and the GSEs—primarily Fannie and Freddie. They were little changed.
That left total liabilities with a $3.5 billion drop, matching the decline in assets.
Bank Loans Outstanding
The Fed releases another report every Thursday known as the H8- Selected Assets and Liabilities of Commercial Banks in the United States. In that report it aggregates the data from all commercial banks in the US into a balance sheet with multiple line items. By tracking it weekly, we can visualize the changing conditions within the financial system virtually in real time. The lag on the reporting date is just 9 days.
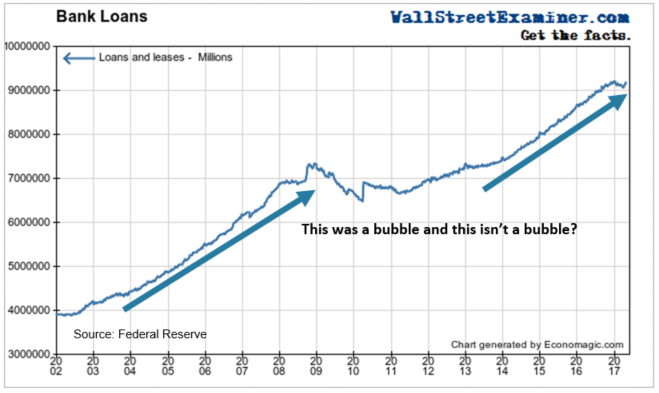
One of the most important items, useful in gauging US credit demand is on total bank loans. Bank loans rose slightly in April after 3 months of declines. The annual growth rate rose to 4.1% as of April 26, up from to 3.6% at the end of March. It’s down from 6% in December. Total loans outstanding are just slightly below the all-time high reached at the end of December.

The uptick interrupts a trend of slowing growth that has steadily come down from 7.4% in September of last year. The growth rate had been between 7% and 8.5% from December 2014 until last September.
Some of the speculation that had driven the economy and the markets has bled off. The uptick this month raises the question of whether another burst of wild speculation lies ahead. Or perhaps the slow bleed will continue. The direction of this line over the next few months could render an important signal for the stock market.
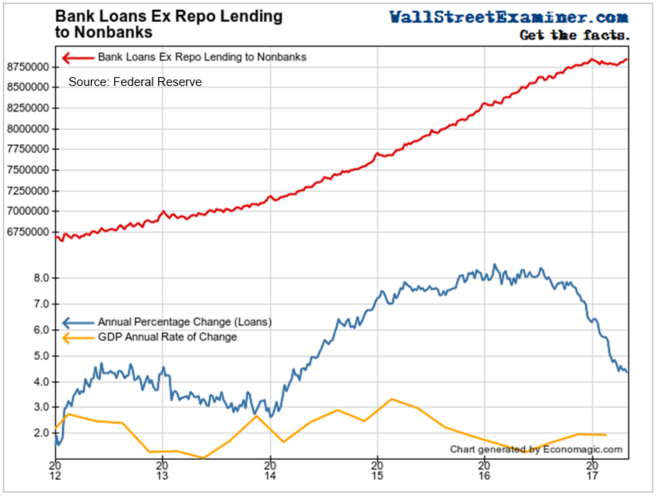
Lending not related to financing securities holdings includes both consumer lending and commercial and industrial lending, but excludes securities financing. These loans rose in April after 3 down months.
The annual growth rate has been slowing dramatically. Even after this month’s uptick to a new high, the growth rate has dropped to 4.4% from nearly 8.5% in mid year 2016.

The current growth rate is still greater than the growth rate of the economy, which has slowed dramatically since early 2015. The rate and persistence of the slowdown in loan growth is greater than any decline since the recession bottomed in 2009.
Growth has slowed but the bubble is still with us. The zombie walks. It’s alive. But this could be its last gasp.
In a subsequent report, we’ll take a look at various types of loans, as well loan loss reserves, and what they tell us about the state of the economy and the financial system.
This report is derived from Lee Adler’s Wall Street Examiner Pro Trader Monthly Macro Liquidity Reports.
Lee first reported in 2002 that Fed actions were driving US stock prices. The US Treasury has also played a role in directly moving markets. Lee has tracked and reported on those relationships for his subscribers for the last 15 years, helping to identify major turning points in the markets in their earliest stages. Try Lee’s groundbreaking reports on the Fed and the Monetary forces that drive market trends for 3 months risk free, with a full money back guarantee. Be in the know. Subscribe now, risk free!


