
Back in September 2012 at the press conference for Ben Bernanke’s announcement of QE, the Chairman was asked point blank by Pedro da Costa of Reuters about perceptions of it being a program that seemed more directed toward Wall Street than Main Street. The answer was the standard boiler plate assumptions that orthodox economists make in terms of aggregate demand. Yes, interest rates are repressing returns on savings and “safe” investment, but the only way to generate sustainably high rates of returns are a healthy economy.
Well we are—this is a Main Street policy, because what we’re about here is trying to get jobs going. We are trying to create more employment, we are trying to meet our maximum employment mandate, so that’s the objective. Our tools involve—I mean, the tools we have involve affecting financial asset prices, and that’s—those are the tools of monetary policy. There are a number of different channels—mortgage rates, I mentioned other interest rates, corporate bond rates, but also the prices of various assets, like, for example, the prices of homes. To the extent that home prices begin to rise, consumers will feel wealthier, they’ll feel more disposed to spend. If house prices are rising, people may be more willing to buy homes because they think that they’ll, you know, make a better return on that purchase. So house prices is one vehicle. Stock prices—many people own stocks directly or indirectly. The issue here is whether or not improving asset prices generally will make people more willing to spend.
The last sentence in the quote above is the “science” that is ultimately at issue here, but it is not so monolithic as it was pretended more than a year and a half ago. Clearly, some people are “willing” to spend more because of asset prices; that is why Porsche, Lexus and Mercedes had a tremendous, record 2013 sales year. The real problem is whether such spending will “trickle down” to the rest of the economy that builds the products and provides the services for all this asset-based “wealth.” So far there does not appear to be much of a multiplier effect.
The other “cost” of heavy monetary intrusion has seen much more attention lately, particularly as interest rates move in the opposite direction than was expected. Once again, investors are voluntarily putting “money” into bonds, particularly “safe” issues, as global growth becomes something more of a precarious prediction. That means the spotlight of inflation turns once more towards the asset prices themselves, i.e., bubbles.
Does the improving economy lead to better stock prices, or do stock prices improve the economy? I’m sure the answer from the FOMC is that they are self-reinforcing in their covariant interactions, but there is more than a whiff of circular logic in that. Stock prices are rising simply because investors want to believe that QE is good, particularly in its purported effectiveness at reducing or even eliminating large and spectacular drawdowns.
There is simply no way to make the opposite case, that the economy is improving and by more than miniscule increments. If Bernanke was right in 2012, as he also stated quite clearly in November 2010, we should be able to detect this “improving economy” outside of stock prices. The unemployment rate is the primary indication in that direction, but the flaws of relying on the denominator for “improvement” are now widely known and add too much controversy. In terms of any easy standard, there should be no doubt that GDP is “improving”, which would provide at least one loose correlation with a healthier economy.

Outside of the third quarter of last year, none of the other five quarters have even matched the 2.9% average of the six quarters that preceded Bernanke’s massive manipulation attempt. And in that one quarter that actually breached the 3% “standard”, its marginal drive was not spending but inventory. Rather, two periods have seen what amounts to zero growth, and a third is barely above 1%. Revisions to the latest quarter are going to send it into contraction.

But is the previous year and a half period really the standard here? The average compound annual rate of GDP expansion since 1947 has been 3.26%, but that includes recessions as well as recoveries and steady growth. That puts a new perspective on failing to improve. The current pace of expansion cannot even measure up to an average that includes recessions (which may be poignant on many levels, including future trajectories).
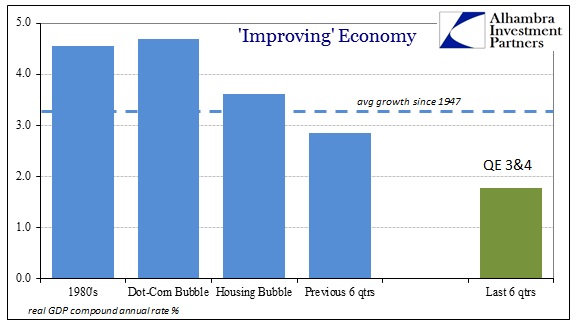
Measuring apples to apples, the periods1983-1989, 1996-1999 and 2003-mid 2006 coincide with what the FOMC is trying to achieve out of “aggregate demand” (particularly the housing bubble period and its debt side); in other words growth on a expansive enough front that it perpetuates for more than three or six months at a time. In broad and general terms, it very much appears as if the correlation between the economy and monetarism is actually negative – as in weaker growth occurs during the heaviest periods of monetary intrusion.
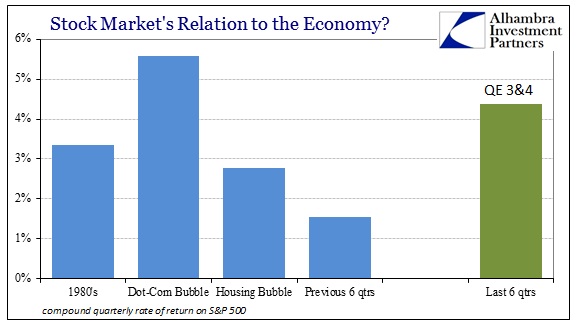
 Setting aside any theories about causation there, we can take a rough measure of stock price behavior during those same periods to try to discern the wealth equation. If Bernanke is correct, then asset price growth should be (very) roughly equivalent to economic growth.
Even in the raw figures, the last six quarters stand out for stock performance, and thus in stark contrast to economic expectations. That would seem to end the idea of a “wealth effect” transmission channel, at least in the current “recovery” period.
In reducing the raw returns to like period returns you can see that the current stock market expansion is comparable only to the dot-com bubble. So where stock price behavior is similar, economic expansion is decidedly not. With the dot-com period there at least existed historically consistent economic growth, with absolutely nothing of the sort lately. The only way to justify such incongruence is to believe (blithely) that stocks were at such a blindingly low discounted price not in 2009 but in 2012 at QE3’s onset.
These observations provide pretty compelling evidence, in my mind, that policymakers were counting on stock prices to create growth and that prices are thus not a reflection of it. Obviously, given this relationship, the only consistent way to justify these divergent behaviors is to accept the premise, on nothing more than faith, that this “wealth effect” will work at some point – meaning stock prices are only trading on future expectations.
But the opposite has actually occurred during the entire time of QE 3 & 4 despite continued promises otherwise. Economic growth has grown weaker, not stronger. Thus, the market expectations for future growth have to also explain this failure; and it’s not like there hasn’t been enough time to establish the QE benefits. In other words, what will change that will suddenly spark the economic growth needed to justify asset prices?
It is becoming harder to rationalize QE and asset prices, which is why there have been more than a few hints coming out of the policy, PhD cohort in recent weeks. Markets are being warned that Main Street policy wasn’t as such, but rather only to the degree that redistribution through asset prices was wholly inefficient. Inefficiency is a primary explanation for persistently weak growth, not the basis for a bull market.
Click here to sign up for our free weekly e-newsletter.
“Wealth preservation and accumulation through thoughtful investing.”
For information on Alhambra Investment Partners’ money management services and global portfolio approach to capital preservation, contact us at: jhudak@alhambrapartners.com

