
The Fed reported last week that:
Industrial production advanced 1.0 percent in April for its third consecutive monthly increase and its largest gain since February 2014. Manufacturing output rose 1.0 percent as a result of widespread increases among its major industries. The indexes for mining and utilities posted gains of 1.2 percent and 0.7 percent, respectively. At 105.1 percent of its 2012 average, total industrial production in April was 2.2 percent above its year-earlier level.”
These were seasonally adjusted (SA) figures, not actual levels before statistical manipulation. The numbers are based on unit output. They tell us the volume of production with no need for an inflation adjustment.
In any case, the Fed’s press release was ebullient. The mainstream media was even more so. Here’s how the Wall Street Journal reported it.

U.S. industrial output rose sharply in April, the latest evidence that economic growth is picking up following a lackluster start to the year.
Industrial production—a measure of output at factories, mines and utilities—jumped 1.0% from a month earlier, the Federal Reserve said Tuesday. That was the largest gain in more than three years.
According to Briefing.com the consensus forecast of economists was for a gain of 0.3%. Ironically, they were probably closer to the mark than the official numbers.
Let’s look at the actual, not seasonally adjusted (NSA) data. We consider the monthly gain versus the same month in past years. Then we look at the annual growth momentum. Was it the largest monthly gain in more than 3 years?
The actual performance for the month was a decline of 1.5% from March. April is always a down month, so there’s nothing new in the fact that production was down last month. However, the average decline for April over the past 10 years was only -1.4%. How could April have been the best month in 3 years? It was worse than average! We only need look back one year to see a better April. April 2016 only had a decline of -0.3%.
However, this year April had 1 less business day than usual as the month began and ended on weekends. So maybe that accounts for the difference between the SA and NSA series.
But do all the nation’s mines, factories, and utilities shut down on weekends? Utilities certainly don’t. Process manufacturing certainly doesn’t. Some manufacturers run 24×7. Robots don’t take days off. Using a seasonal adjustment to come up with the claim that this was the best month in 3 years is just BS.
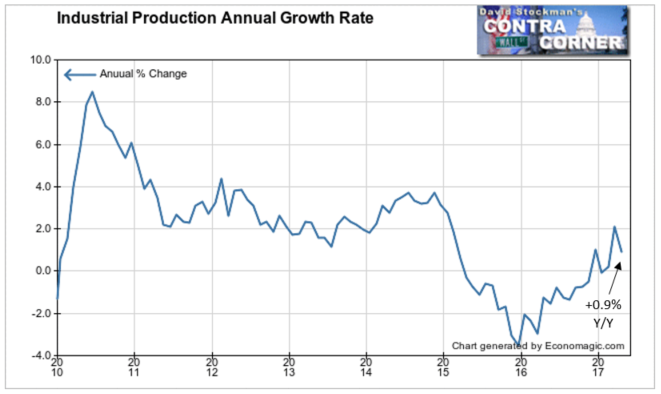
We’re also skeptical of the claim that the annual growth rate was 2.2%. Comparing the same month from 1 year to the next should not be done on a seasonally adjusted basis. Using the actual NSA data the gain was 0.9%. At least it was positive.
The calendar may have made a slight difference, but it’s impossible to accurately estimate how much. They made up an adjustment that was pure nonsense and didn’t disclaim or explain. This is the economist’s modus operandi. Never disclaim. Never explain.
So is there any evidence that things are picking up after a slow start to the year? In fact, the annual growth rate was higher in March, and the uptrend in momentum actually began early in 2016 from a very weak level of -4% year to year. So yes, production has gained. But it is still barely positive year to year. That’s hardly a sign that growth has begun to improve.
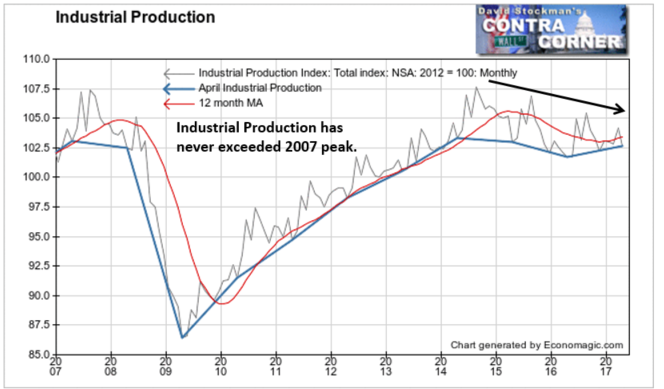
In fact, while total production is up 0.9% year to year, it’s still below the level of April 2015 and April 2014. And we have never surpassed the peak levels reached in 2007.
Here’s another way to tell that this so called pickup in activity is pathetic. April always has the lowest production of the year. But during the recovery from 2009 to 2014 it never fell significantly below the 12 month moving average. There was just one slight break in 2011. But last month was below the 12 month moving average for the third straight year. There had better be strong improvement in May. Another weak month would put IP back in recession.
The recovery, such as it was, ended in 2014. Since then, despite the Fed holding interest rates below 1% and despite ongoing money printing around the world, there’s just no growth in demand for what the US produces. We are DEAD IN THE WATER!
But look at the stock market relative to the production level. It’s clear from this chart that the stock market has been in a bubble at least since 2013. That’s when stock prices broke out and IP didn’t. Then in the past 2 years, the stock market has become completely unhinged from the level of production, moving up while production moves down.
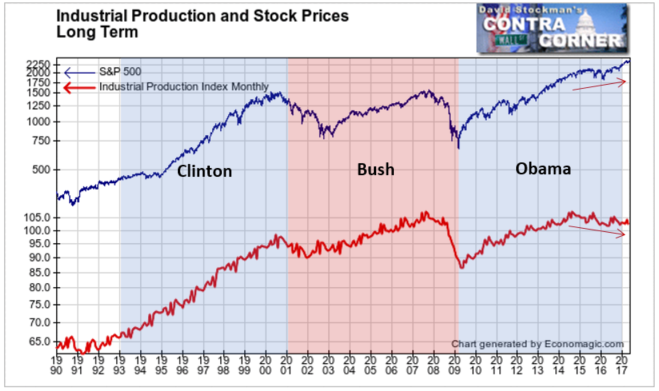
Such a divergence is historically unprecedented. The longer it goes on, the worse the adjustment is likely to be.
How much longer will it go on? Probably not much. The 1991-1999 expansion lasted 8 years and topped out in the 9th. The 2003-2007 expansion was a mutant, lasting only 4 years. The current expansion has been ongoing for 8 years.
The current bubble could be like the expansion from 1992-1999. They both had something in common. The Federal budget deficit was declining between both 1992 and 1999, and then between 2009 and now. Big increases in deficit spending from 2001 to 2009 were accompanied by two massive bear markets.
The Trump budget is unknown. He wants big increases in infrastructure and military spending that would blow out the deficit. He reportedly wants to pay for that by deeply cutting social programs. It’s doubtful that Congress will pass all of those cuts. So budget deficits will grow. Federal debt will increase and suck capital out of the financial markets. That should trigger another massive bear market. My technical work suggests that probability begins to favor that downturn beginning this year, perhaps as soon as this summer.
Follow Lee’s weekly market timing reports, including ETF trading recommendations, in the Wall Street Examiner Pro Trader Market Updates. Currently open picks have an average gain of 9.2% and an average holding period of 39 days. Try the service risk free for 90 days.

