“U.S. Retail Sales Rose 0.6%, Pointing to Confident Consumers,” headlined the Wall Street Journal on Friday. It was talking about the top line seasonally adjusted version of the month to month change, including inflation. We’re more interested in the actual data, not data that is statistically massaged to create an idealized version of the trend, which is what seasonally adjusted data does. That representation may or may not be accurate in any given month. As a technical analyst first, I’d rather look at the momentum of the actual changes from month to month. That gives us a clearer understanding of the progression of the trend, without the often misleading seasonal adjustment statistical trickery.
On a month to month basis, actual sales in September dropped by -5.5%, which is perfectly normal. September sales are always below August sales. The drop in September 2015 was -5.6%. The 5 year average decline for September is -6.8%. Last month was a little better than the average.
On an annual basis the actual, not seasonally manipulated numbers had a year to year increase of +3.4%. That sounds reasonable enough. It’s smack in the middle of the annual growth rate for the previous 12 months, which has ranged from +0.9% to +6.9%. In August, the year to year growth rate was +3.4%. September’s is a middling performance in nominal terms.
These numbers include price increases, so unit sales growth is lower. We’ll address that in a moment. But first there are a couple of things that are interesting about the nominal sales trend. Raw data is good data. It just needs to be charted over the longer haul to give some perspective.

Except for the recession, growth since 2003 the annual growth rate has been between 2.5% and 7.5% in September. Not shown on this chart are two peaks, in 1994 and 1999, when the growth rate hit 10%. Even during the housing bubble which peaked in 2005-06, it never got that high. When the growth rate dropped below 2.5%, the stock market had already broken down. That also occurred in 2001 (not shown). Stocks broke down. Retail sales followed. Retail sales are not a leading indicator.
What may be a leading indicator is growth momentum. It steadily slowed from 2003 to 2007 as fewer and fewer consumers profited from the spoils of the housing bubble. Today, a similar momentum decline has been under way for 5 years as even fewer people participate in the central bank driven financial engineering bubble. Hedge fund billionaires and bankers can only spend so much before their spending slows down too. After 5 years of steadily slowing top line retail sales growth, I think that there’s reason to worry that the stock market may also be near a tipping point similar to 2007.
The directional correlation between stock prices and retail sales is high. The two lines tend to move in parallel until the final stage of the stock market bubble. Stock prices then rise faster than retail sales as the bubble blows off, but the retail consumer is barely running in place.
That process lasted not quite 18 months at the 2006-07 top. This time it has been going on for almost 4 years! What more proof do we need of the failure of Ben Bernanke’s theory that rising stock prices would trickle down to the masses through the magic of “business confidence?
In September 2009 the stock market had already turned the corner and come sharply off the lows. Since then stock prices have risen by nearly 100% over and above what they gained in the bungee rebound from March to September 2009. Retail sales are up only 31.5% since September 2009. Retail sales gained 18.8% in the 3 years from 2009 to 2012, but just 15.5% in the 4 years since 2012. Retail sales were up by an average of 6.2% per year in the first 3 years of the recovery . In the last 4 years, they averaged only +3.9% per year.
Meanwhile, stocks rose 46.6% from September 2012 to now, or 11.7% per year. They rose 33.7% from September 2009 to September 2012, or 11.2% per year. While the stock market has continued to ramp steadily with central banker wind at its back, retail sales growth has slowed dramatically. You don’t need to be a genius to see that not much of the stock market gains are trickling down. The longer the stock market bubble goes on, the less trickle reaches the middle class, not to mention those below median income, who can barely even pay the rent.
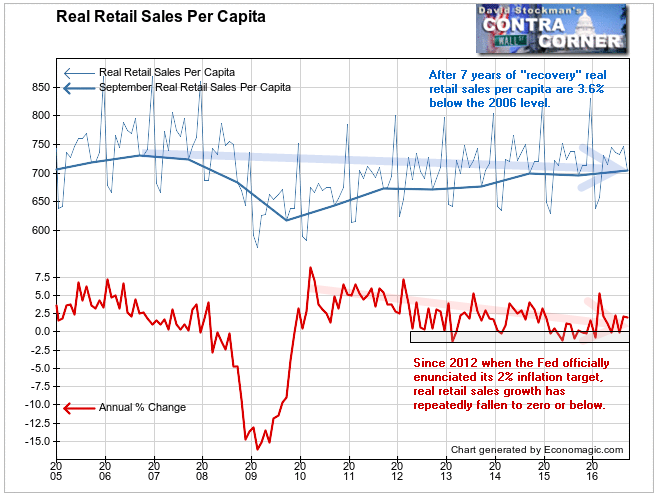
As ominous as the nominal sales data may be, it gets worse when we start stripping off the layers of the onion. One layer is the inflation component of the sales. The other is population growth. Eliminate those two contributors to sales growth and we see just how dire the situation is. On the whole, retail spending by US consumers has stalled. It’s not possible to segment the data by income strata, but we can look at the averages, and considering that we know that the bulk of the income growth has been at the top income strata, the only logical conclusion is that the supposed trickle down has pooled at the top. The structural foundation of sales to the masses is increasingly fragile.

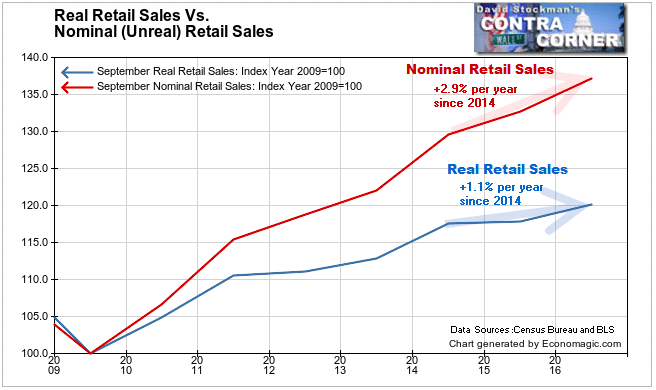
As nominal retail sales have raced ahead, real retail sales, adjusted by the PPI for finished retail products, have increasingly lagged. While nominal retail sales have risen by a total of 5.8% over the past 2 years, real retail sales have risen by just 2.3%, barely over 1% per year. Sadly, almost all of that is population growth. On a per capita basis, there has been virtually no growth at all.

In economics they say that a rising tide lifts all boats. Apparently either this tide isn’t rising any more or the smaller boats have all been shipwrecked on the shoals of the the Sea of Free Money.
Lee Adler first reported in 2002 that Fed actions were driving US stock prices. He has tracked and reported on that relationship for his subscribers ever since. Try Lee’s groundbreaking reports on the Fed and the forces that drive Macro Liquidityfor 3 months risk free, with a full money back guarantee.


