By Tyler Durden at ZeroHedge
Over the past year we have regularly contended that a far greater threat to the global economy than either corporate earnings, currency devaluations, rate cuts (or hikes), reserve outflow, or even the stock market, is the sudden, global trade crunch which has been deteriorating rapidly since late 2014 and has seen an even more dramatic drop off as 2015 is winding down. Actually, that is incorrect: global trade is merely a manifestation of the true state of the above listed items.
First, there was ships.
Back in March, we reported that “Global Trade Volume Tumbles Most Since 2011; Biggest Value Plunge Since Lehman.”
Then in August when we first pointed out a dramatic slowdown in the Baltic Dry index which had peaked just a few weeks earlier and we said that “should the dead cat bounce in shipping rates indeed be over, and if the accelerate slide continues at the current pace, not only will shippers mothball key transit lanes, but the biggest concern for global economy, the unprecedented slowdown in world trade volumes, which we flagged a week ago, will be not only confirmed but is likely to unleash yet another global recession.”
Three weeks later, we we got confirmation that the BDIY has indeed become a lagging indicator to actual demand, when Reuters reported in its latest weekly update using data from the Shanghai Containerized Freight Index, that key shipping freight rates for transporting containers from ports in Asia to Northern Europe fell by 26.7 percent to $469 per 20-foot container (TEU) in the week ended on Friday.The collapse in rates is nothing short of a bloodbath: “it was the third consecutive week of falling freight rates on the world’s busiest route and rates are now nearly 60 percent lower than three weeks ago.
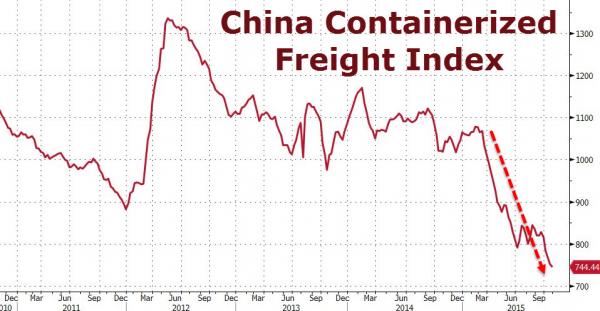
Fast forward to the latest update from the China Containerized Freight Index which as of October 30 has fallen about as far as it ever has in history: at 744.44 it was the lowest on record which suggests that beyond the headline propaganda of some nascent recovery, global trade has literally fallen of a cliff.
And while one could try the usual excuse and blame an excess supply of ships, while ignoring the fact that a third of all containers shipped out of the ports of LA and Long Beach port are now empty…
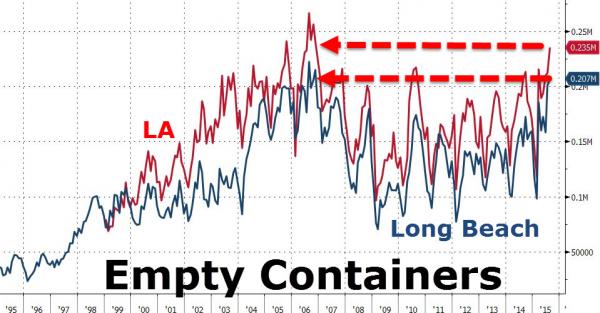
… apparently a supply which was “not there” earlier this year when the Index was more than 50% higher, that excuse won’t hold when looking at what is going on inside the US itself.
Then there was trains.
According to Reuters, “freight carried by major U.S. railroads fell by 7 percent in the second quarter of 2015 compared with the same period in 2014, confirming that large parts of the industrial economy are in recession.”
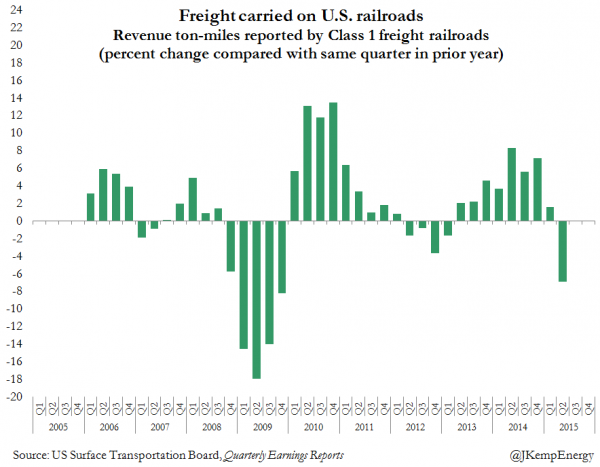
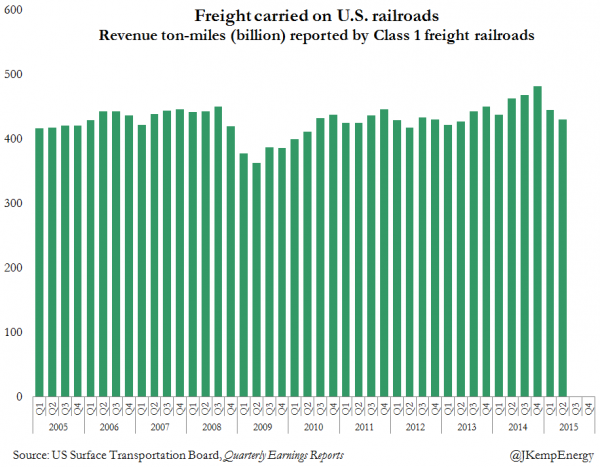
It adds that the major Class 1 railroads carried 431 billion ton-miles of freight in the three months ending June, down from 463 billion ton-miles in 2014, according to the U.S. Surface Transportation Board.
Changes in freight volumes reflect broader difficulties in the industrial economy. Rail operators have been struck by a perfect storm which has hit both their traditional and new business lines.
The main drivers for the slowdown are all those commodities that make the backbone f America’s industrial economy:
Coal shipments to power plants, the biggest commodity on the network, accounting for about one-third of total tonnage, have been hit by a combination of environmental regulations and low gas prices. Coal shipments were down by 27 million tonnes, around 15 percent, in the second quarter compared with same 2014 period.Petroleum shipments, one of the fastest growing sources of new business during the oil boom, fell more than 650,000 tonnes, 5 percent, as production began to peak and new pipelines diverted crude from the rails.
And shipments of sand and gravel, a key ingredient in fracking, plunged by more than 2 million tonnes, nearly 14 percent, as the number of new wells drilled and fracked tumbled.
It’s not just these well-known culprits: shipments of a range of other items from chemicals to fertilisers and other industrial supplies were also lower as the industrial economy ran into stiff headwinds from a stronger dollar and sluggish capital spending.
Other sources also confirm that the slowdown in industrial-related freight has continued into the second half of the year. Total traffic on U.S. railroads in the 42 weeks ending on Oct. 24 was down 1.3 percent compared with 2014, according to weekly carload statistics published by the Association of American Railroads (AAR).
Shipments of intermodal shipping containers, which mostly handle manufactured products, were up 2.2 percent but shipments using box cars, tank cars, hoppers and gondolas, which handle farm and industrial products, were down 4.5 percent. Shipments were down in five of the 10 freight categories including coal (10 percent), forest products (3 percent), metallic ores and minerals (10 percent), nonmetallic minerals (2 percent) and petroleum (7 percent).
The downturn has deepened and spread to more sectors as the year has progressed, according to AAR data.
The number of cars carrying coal is down 10 percent so far this year but almost 13 percent in the most recent week. The number of cars carrying petroleum and petroleum products is down 7 percent year-to-date but almost 22 percent in the most recent week.
But the most vocal confirmation comes at the micro level, companies themselves. In its third quarter earnings presentation on Oct. 22, Union Pacific, the largest publicly owned railroad, acknowledged freight had shrink in five of six categories during the quarter compared with 2014.
Union Pacific carried lower volumes of farm products (3 percent), chemicals (3 percent), containers (4 percent), industrial products (12 percent) and coal (15 percent). The only sector to increase was automotive (5 percent).
Other publicly owned railroads all reported falling volumes during the third quarter compared with 2014.
Norfolk Southern blamed a “decline in metals and construction traffic due to softer steel production” and reported a 16 percent in coal volumes. Kansas City Southern reported that its volumes were down 2 percent including a 24 percent decline in frac sand. CSX reported volumes fell 3 percent including a 15 percent drop in metals traffic and an 18 percent drop in coal.
* * *
And then there was trucking.
As reported here a week ago, as recently as 2014, trucking had been booming in what many saw as a banner year.
Capacity was squeezed, and rates were rising, so trucking companies went on a buying binge, ordering everything in the book in preparation for red-hot demand in 2015 and more banner years down the road. But then came 2015.
Among businesses, over-ordering and tepid sales caused inventories to rise and the inventory-to-sales ratio to spike to Financial Crisis proportions. And now businesses are trying to bring them down by trimming orders because they’re having trouble selling more to the middle class, the over-indebted modern proletariat whose stagnant incomes are being eaten up by skyrocketing costs of housing, healthcare, college, and the like – and they simply can’t spend that much on shippable items.
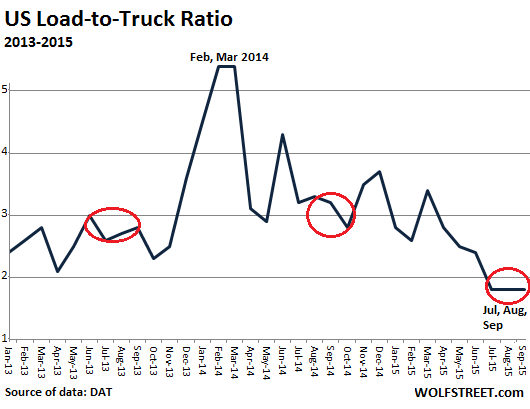
Unusually “slack demand” in September – the beginning of shipping season – after “a quiet July and even quieter August,” impacted most of the nation, except in the Pacific Northwest, where “fall harvests of apples, potatoes and onions rolled to market in vans as well as reefers,” explained Mark Montague, a statistician at DAT.
September looks terrible compared to September in banner-year 2014. It still “looks anemic even when compared to the more typical freight movement of September 2013,” Montague said. This slack demand whacked load-to-truck ratios. And that matters:
Load-to-truck ratios signal changes in the marketplace that are usually reflected in truckload rates. In the past five years, a change in the load-to-truck ratio has correlated at a rate of 0.8 with an immediate change in spot market rates, and a sustained change in spot market rates is typically followed by a change in contract rates, as well.
Since late last year, DAT’s van load-to-truck ratios have been on a declining trend. Every month this year, the ratios were below the ratios in 2014. In July, August, and September, the ratios hit 1.8, the lowest in years. In September, the ratio was 42% below a year earlier:
Trucking is a thermometer for the merchandise economy. It doesn’t track consumer expenses like rent or college. But it tracks exports and imports, manufacturing, distribution, retail, and other sectors. It tracks a big part of the real economy. And the sudden slowdown in the trucking industry is another wildly flashing signal in our recession watch.
* * *
We have in the past joked that the only thing that could possibly save the world from what is a trade recession is if the central banks can somehow find a way to “print trade” the way they artificially boost asset prices higher to give the impression of a status quo normalcy. Unfortunately, as this is not a real option, and with both global and US trade in freefall, many wonder just how will the world’s central planners mask this most dangerous aspect of the global economic slowdown?