First let’s go to the slant. The Wall Street Journal spun the tall tale that “U.S. Existing-Home Sales Rebounded in September.” The Journal also claimed that the “Rise ends two-month slide as housing sector shows signs of stabilizing.”
As for the facts, I can only say that either the Wall Street Journal’s reporters have no clue how to read the actual data that lies beyond the headline numbers, or that there is something absurdly wrong with the NAR’s seasonal finagling algorithm. On second thought, I’ll say both.
I frankly cannot understand how the mainstream media can report industry headline PR without at least giving lip service to the fact that actual data exists that hasn’t been touched by statisticians’ grubby hands. Nowhere in their report did the Journal’s reporters mention that there’s hard, unmanipulated data available for analysis. They also never consider that there might be something wrong with the seasonal adjustment, either in this instance or in general.
Maybe in the Wall Street Journal’s case, we should understand it. News Corp., the parent company of Dow Jones, the publisher of the Journal, also has a division called Move Inc. This subsidiary operates Realtor.com, which is the online and mobile marketing platform of the National Association of Realtors. If you have ever looked for a home, you have probably used that site and were unaware that it is a division of the same company that owns the Wall Street Journal. Pretty slick.
News Corp. also owns an outfit called NewsAmerica Marketing, whose slogan is “Your marketing objectives are our business!” Not news. Not unbiased analysis, not “in depth reporting,” but meeting the marketing objectives of corporate marketers. One thing that News Corp. does not say is that they are in the business of helping their readers meet their financial objectives.
Having dispensed with this public service message, let’s get to the actual data in the NAR’s report. First, there’s the idea “U.S. Existing-Home Sales Rebounded in September.” OK, so that didn’t happen. In fact, September sales were awful. There was no rebound. The Journal’s Ben Leubsdorf and Jeffrey Sparshot dutifully reported the NAR press release, which said that sales “rose 3.2% from August to a seasonally adjusted annual rate of 5.47 million in September,” adding the kicker that this was better than Wall Street analysts expected. Yippee!
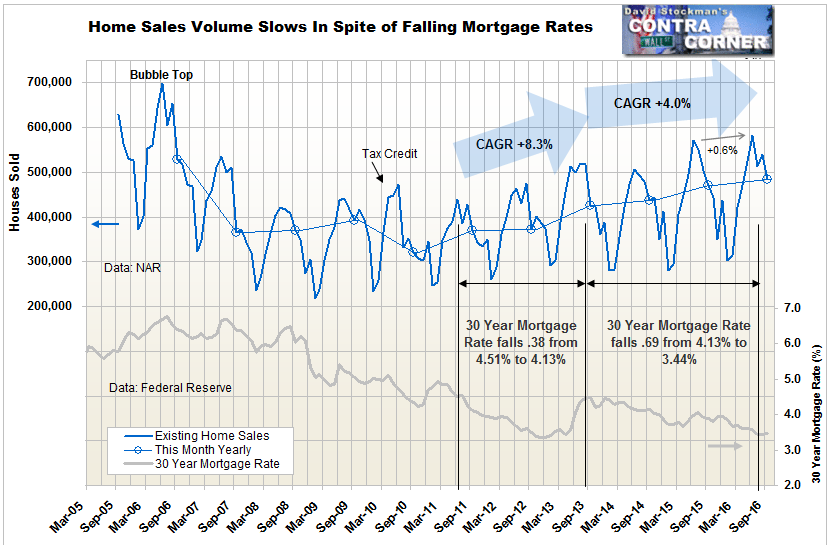
Before the statisticians massaged the data into a seasonal horror show, it turns out that actual September sales totaled 484,000, falling by 55,000 units from August. Given that September is always a down month, we need to compare that change with past Septembers to see how this one stacks up. This decline was larger than the September 2015 decline of 33,000, and larger than the September 2014 decline of 43,000. Earlier in the housing “recovery” September did worse, but the recent comparisons are not good. The usual decline in September has gotten worse for 3 straight years.
The actual year to year growth rate was 2.8%, which isn’t horrible but is weaker than the August year to year gain of 6.9%. So instead of indicating a rebound in September, sales momentum actually fell. There was no rise ending a two-month slide, and contrary to signs of stabilizing, the data pointed to growing weakness.
For the third quarter as a whole, total sales were just 0.7% higher than Q3 of 2015. That’s less than the rate of US population growth, which the Census Bureau data shows is typically 0.9% to 1% per year. The peak to peak rate of change from June 2015 to June 2016 was 0.6%. A year ago, the September year to year gain in home sales was 8.3%. The recent data suggests that the existing home sales market is now at stall speed. We need to be on the lookout for a sudden drop in sales volume that would be the likely precursor to the next housing crash.

The market has come to this point with the benefit of being on life support from all time record low mortgage rates. It doesn’t require much imagination to visualize what would happen if rates are allowed to rise.

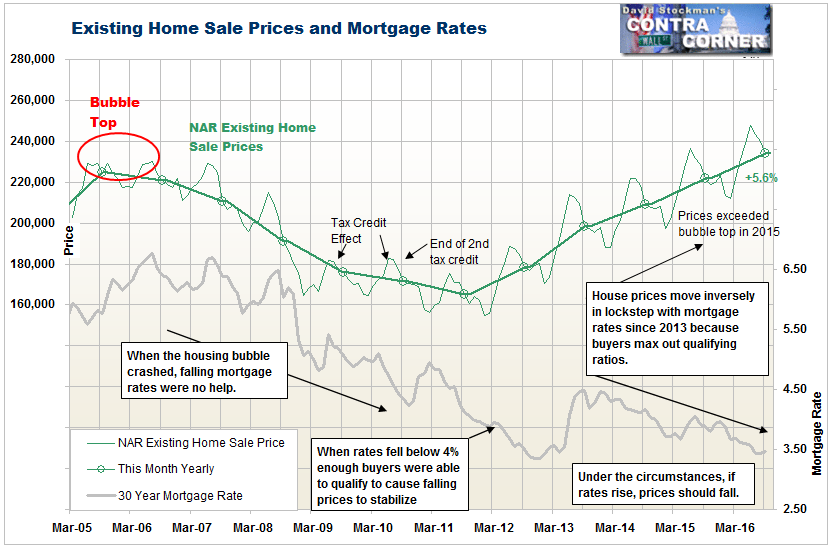
In terms of how much buyers will pay for a house, they are really only concerned with the monthly mortgage payment. Falling mortgage rates give them an interest payment subsidy. As the interest portion of the payment declines and the total monthly payment remains constant at the max the buyer is able and willing to pay, the principal portion of the payment increases. That is price inflation in its purest form. The money supply increases because as the Fed subsidizes the interest component, mortgage loan balances increase. As loan balances increase, the money supply increases.
Monetary inflation and housing inflation are siamese twins. They can’t be separated, but economists and central bankers don’t count this as “inflation.” The increase in housing prices is not included in the CPI. Instead it’s replaced by a tortured statistical construct called Owner’s Equivalent Rent (OER). OER represents the insane concept that consumers’ actual housing expense is the amount of rent the owner thinks his house would bring if it was a rental property.
In spite of seeing no inflation, hearing no inflation, and speaking no inflation, central bankers have in fact caused housing inflation. It’s a result with which they are secretly thrilled. That’s because housing inflation theoretically increases the value of existing loan collateral, making banks, mortgage banks, and GSE’s appear to be financially healthier than they really are. I say theoretically because in reality, in an unsubsidized market, these prices would not exist and loan collateral values would be much lower. Another way of looking at it is if just a few extra people want to or need to liquidate their properties and put them on the market simultaneously, these prices would instantly be vaporized.
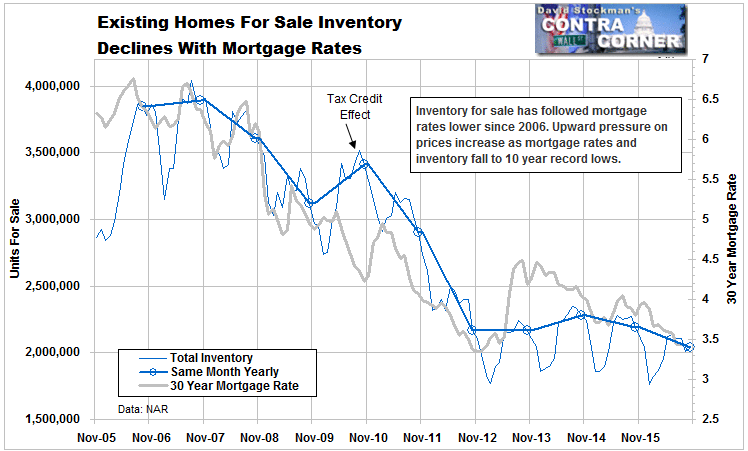
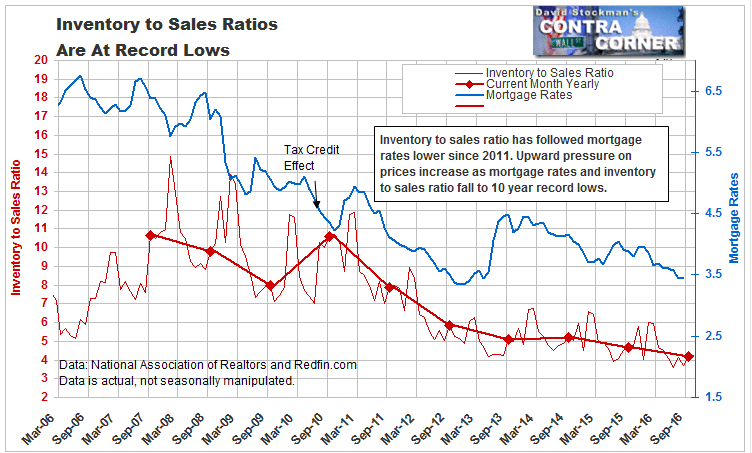
Therefore, inherent in current collateral value inflation is the growing risk of another collapse in prices when mortgage rates rise. Central bank subsidized, low mortgage rates have not only stimulated demand at higher price levels than would be the case in the absence of the subsidy, this excess demand has taken more supply off the market than it would have if rates had been higher. In addition, at the margin, older homeowners who would liquidate their properties if they could earn a reasonable return on cash, instead hold on to their real estate. Here again, if rates rise, supply would increase concurrent with falling demand. It could lead to the perfect storm of both volume and prices spiraling down together.

The Fed’s suppression of mortgage rates has distorted the supply/demand equation to an unprecedented degree. As this imbalance persists, prices will continue to inflate until a point of no return is reached. At that point, monthly payment affordability limits will force more potential buyers out of the market. As demand falls, sales will dry up, and the market will seize up. A massive wall of panicked supply might then hit the market.

Far from seeing signs of recovery in this month’s data, honest reporting and analysis would reveal that the fundamentals of housing inflation are sowing the seeds of destruction.
Lee Adler first reported in 2002 that Fed actions were driving US stock prices. He has tracked and reported on that relationship for his subscribers ever since. Try Lee’s groundbreaking reports on the Fed and the forces that drive Macro Liquidity for 3 months risk free, with a full money back guarantee.


