
The mainstream media noted correctly this week that auto sales had slowed. However, as always, they ignored the long term perspective and either glossed over or ignored the implications of this weakness. “The automakers and the economy are in much better shape than the last contraction,” say the Wall Street pundits, “so this little bout of weakness won’t be too bad.” Rosy Scenario, Director of Industry Infomercials at CNBC, approved the message.
September light motor vehicle sales (autos and light trucks) were down 2.7% on a year to year basis. It was the fourth year to year decline in the past 5 months. That’s the short run. The longer term perspective is a bit more troubling.
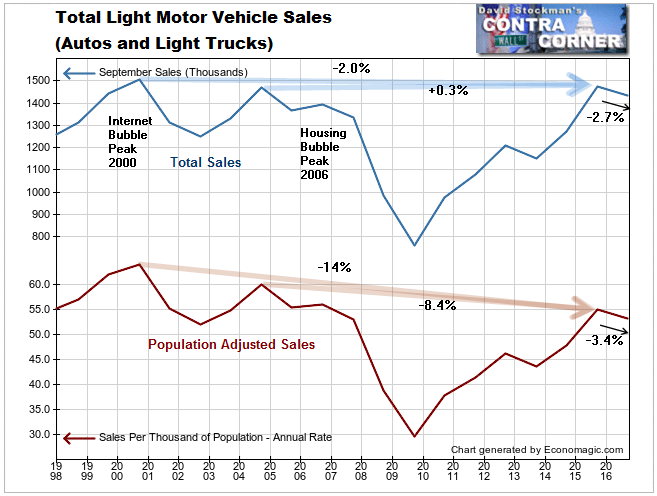
September 2015 total sales were up 0.3% from the last peak in 2004 in the middle of the housing bubble. The downturn in auto sales from that peak actually foreshadowed the peak of the housing bubble in 2006 and the stock market high in 2007. Looking back a little further, sales are now down by 2% from the peak in 2000 when the internet bubble was beginning to roll over.
Considering that US population grows by about 1% per year, just on the basis of population growth alone we would expect that sales would be up by 16% since 2000, not down by 2%. After all, Ben Bernanke assured us that wealth from a rising stock market would trickle down to the masses. Apparently that hasn’t happened. Sales are actually in a secular downtrend on a population adjusted basis. Sales per thousand people have fallen by -8.4% since 2004 and by -14% since 2000.
These declines were measured to the 2015 peak. Over the past 12 months total sales have declined an additional -2.7%, and population adjusted sales fell by -3.4%
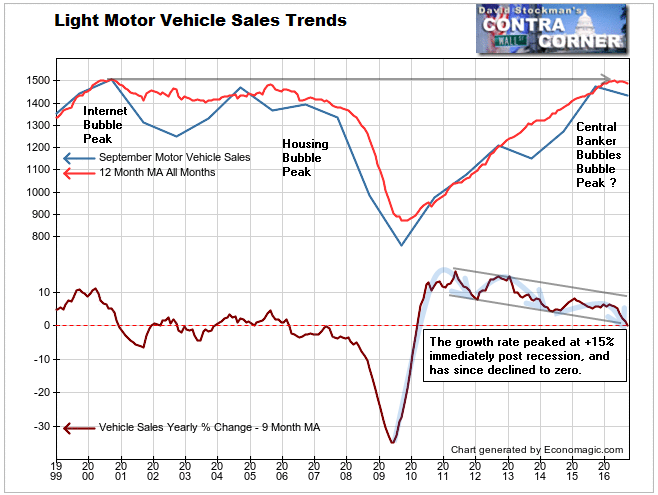
The 12 month moving average of total sales has now broken the uptrend that developed from the 2009 recession low. It has done so from the same level where this measure peaked in 2000 and 2005. Both were followed by devastating bear markets in stocks and concurrent economic recessions. This is another reason to be cautious, if not worried about the outlook from here.
The annual growth rate for total unadjusted sales has now sunk to zero on the basis of a 9 month moving average. Prior to May of this year the annual growth rate was persistently positive since the recovery began. This slowing isn’t just a flash in the pan. It is a continuation of a persistent trend of slowing growth since 2011. That trend shows no sign of reversing.
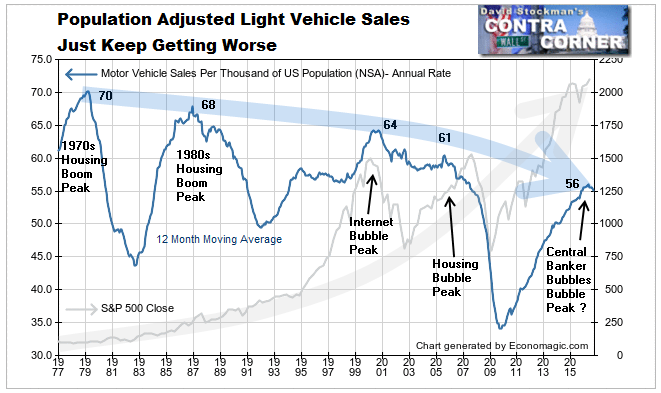
Overlaying population adjusted vehicle sales with the S&P 500 illustrates the accelerating decline of US living standards as the stock market has soared over the past 40 years. There has been no trickle down whatsoever. That theory is a massive fraud perpetrated on the public by the economic priesthood. The annualized rate of September sales has declined from 70 to 56 per thousand people since 1979. That’s a 20% decline. Meanwhile stock prices have soared by 2000%.
The decline in vehicle sales has actually accelerated since 2000. We believe that monetary policy has at least exacerbated this trend, if not directly caused it. The benefits of ZIRP and QE are concentrated in the financial sphere, flowing mostly to bankers and leveraged speculators.
Meanwhile interest income on basic savings has been crushed, reducing the disposable income of savers and eliminating any possibility of growing the principal which can contribute to major purchases. Older consumers are often forced to consume principle, ultimately forcing many to abandon any discretionary spending.
Meanwhile younger consumers have been encouraged to take on debt at rates that are unsustainable beyond a certain point. That point seems to have been reached. If your existing car loan is under water and you have no equity in the vehicle, it becomes increasingly difficult to purchase a new car. Central bankers who have continually encouraged the public to take on ever more debt never seem to consider that.
At the same time, central bank policies have made it far more profitable for businesses to invest in financial engineering schemes than in developing their labor forces. So the US stock market continues to soar, and the US economy continues to weaken. The result is more middle class suffering leading to more political and economic upheaval.
The data on the underlying trends shows no sign of reversing. There’s no reason to believe that these weakening long term trends will reverse without a major cleansing of the financial system. So far, the firm Greenspan, Bernanke, Yellen, Kuroda, Draghi and Company have refused to allow that cleansing. They have instead sought to constantly delay or paint over the needed correction of the housing bubble excesses.
Now we are approaching a point where the markets will force them to face reality. Central banks have already kept rates at zero or below throughout an entire business cycle, and it appears that they have exhausted the potential of what money printing can do to drive markets higher. We may not be certain as to where the market’s limits are but the risks are enormous, and the longer the markets remain at current levels or go higher, the more painful the adjustment is likely to be. This time, central banks won’t have the tools to paint things over again.
Lee Adler first reported in 2002 that Fed actions were driving US stock prices. He has tracked and reported on that relationship for his subscribers ever since. Try Lee’s groundbreaking reports on the Fed and the forces that drive Macro Liquidity for 3 months risk free, with a full money back guarantee.

