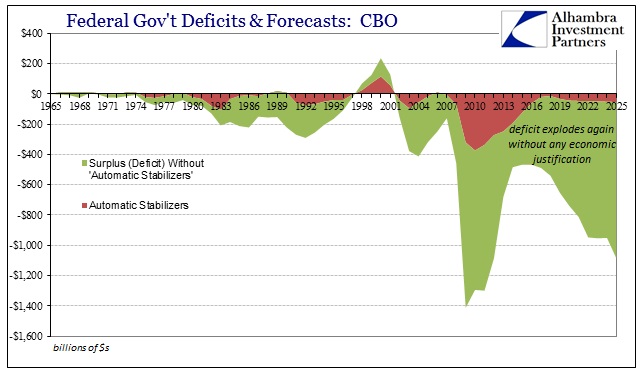
Last week, the CBO updated some of its calculations and methods for estimating the effects of “automatic stabilizers” on the deficit. These are Keynesian concepts whereby the government increases spending or redistribution (redundant) without discretion as the economy falls into the downside of a cycle. For the CBO’s purposes, the agency measures automatic stabilizers not on their effects, intended effects or, more accurately, lack of effects, but rather to create a baseline of the federal deficit apart from the role orthodox economics has somehow assigned.
What they find is that the deficit is set to head back to the $1 trillion level by 2022 without any economic justification for it – in other words all the government “spending” on its own. That is itself a concern, and a big one, but the more immediate apprehensions surround what happens in the actual economy long before we ever get that seriously troubled.
The economic assumptions upon which this alarming scenario plays into are all that you have seen time and again. Namely, a big economic hole starting around late 2007 and into 2008 and then nothing, followed by a sharp upturn starting at whatever point the CBO’s estimates take over from current measurements. In other words, the unmistakable recovery that is always, always just out of reach.
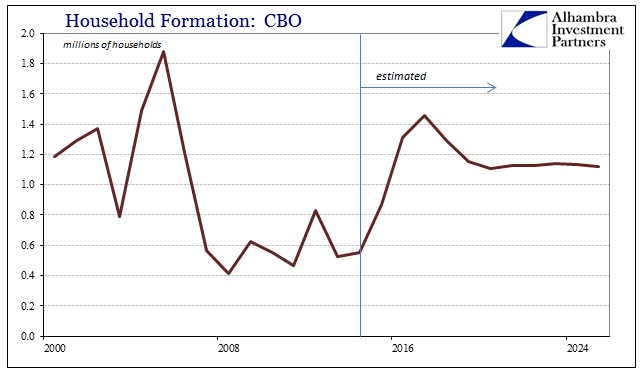
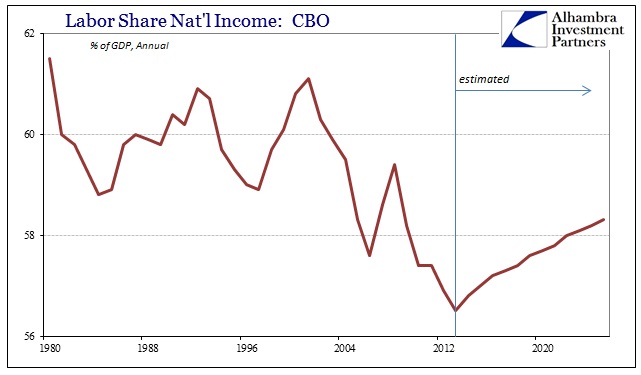
The CBO demonstrates this in any number of discrete economic pieces, but with all the same trend. This pattern is simply duplicated year after year, with the unambiguous recovery simply moved one calendar turn further down at each annual update to the projections. Two such relevant examples are shown below:
Household formation, which was clearly and disastrously wrecked by the Great Recession, is supposed to return back to trend last seen during the go-go days of the housing bubble by next year. The basis for that is the second chart, which shows the losing share of labor and earned income as proportioned of GDP during this serial bubble age. For some reason, the CBO just expects that decade-and-a-half decline to stop and then start modestly back toward more elegant economic function. The reason for that inflection is explained as:
Of the categories of income, the most important components of the tax base are labor income, especially wage and salary payments, and domestic corporate profits.
In CBO’s projections, labor income grows faster than the other components of GDI over the next decade, increasing its share from an estimated 56.8 percent in 2014 to 58.3 percent in 2025 (see Figure 2-13).20 The projected increase in labor income’s share of GDI stems primarily from an expected pickup in the growth of real hourly labor compensation, which will result from strengthening demand for labor.
That’s right, yet again the entire recovery is placed upon the Establishment Survey view of everything, the “strengthening demand for labor.” There is no further justification for why that is supposed to, out of nowhere, finally occur, nor is there any explanation as to why it hadn’t all the way to 2014 (the latest data when these projections were made); especially where the hundreds of billions in “automatic stabilizers” are totally devoid of that expected response. The recovery just is.
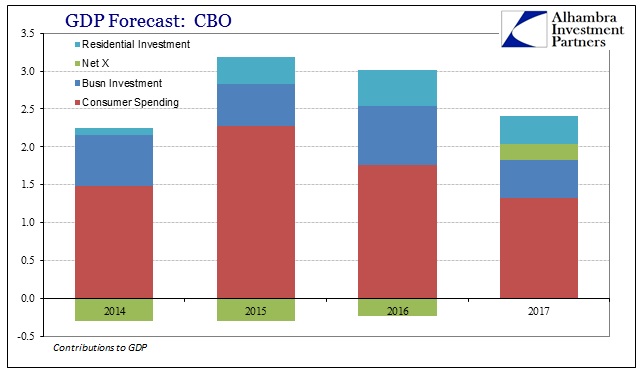
Upon that justification alone, GDP for 2015 was (and remains until the next full update) expected at 3% or slightly better. The foundation of such economic growth was consumer spending, which is the rightful accompaniment of a truly strong labor market.
Of that 3% in GDP forecast for this year, 80% of it was to be driven by consumer spending – which is why the downgrades so far at the Fed, IMF and everywhere else are devastating. The “strong labor market” is yet again revealed as a figment of some trend-cycle numbers, but it is getting much, much worse than the usual annual “next year maybe” disappointment. Retail sales have been atrocious this year (seasonal adjustment for one month only notwithstanding) but other indications are actually somewhat worse. Further, the narrative, excuses and general confusion that accompanies the lingering consumer problems actually demonstrate, in sequence, quite well this ongoing and “unexpected” disassociation.
Thomson Reuters calculates and maintains a consumer index made up of same store sales figures from 76 individual retailers. In January, the narrative was still, despite many other indications otherwise, that the holiday period was not only great but indicative of what to expect for the coming year.
Black Friday’s hot retail numbers in November continued into the December holiday selling season, as the Thomson Reuters Same Store Sales Index registered a solid 5.1% gain, beating the final estimate of 3.8%. Excluding drug stores, the SSS index registered a 2.8% increase in December, beating its 2.5% final estimate…
Shoppers were in a buying mood, a sentiment in line with our Thomson Reuters Ipsos Consumer Outlook Index (TRIp) which indicates good feelings about 2015. As a result of stronger November and December SSS, analysts have been increasing projections for the fourth quarter. Our Thomson Reuters Quarterly Same Store Sales Index, which consists of 76 retailers, is expected to post 1.8% growth for Q4 (vs. 0.7% in Q4 2013).
There is a lot of contradiction in those quoted passages, starting with the same store number ex-drug sales. For the quarter, 1.8% growth might have been much better than Q4 2013 but still way, way below where the consumer “should” be especially given the “greatest jobs market in decades.” That meant the data was mixed but still enough for the consumer narrative to be at least plausible. There was no need to refer to the jobs market at that point because it was simply undisputed.
Only one month later, in early February, Thomson Reuters was already into the “snow”:
Falling prices at the gas pump drew shoppers to the malls in January, yet winter storms also had an effect on traffic. The Thomson Reuters Same Store Sales Index is expected to indicate a weaker retail environment than a year ago. The SSS is expected to post a 2.6% gain in January 2015, down from the actual 3.1% increase recorded a year ago. Excluding the drugstore sector, the SSS growth rate is seen as dropping to 1.1%, below the actual 3.6% result posted in January 2014…
January marks the last month of the retail industry’s fourth quarter and things look brighter this year for that period. Overall, analysts believe that lower gas prices and the improvement in the job market will benefit the sector as a whole. Consequently, analysts have been raising fourth quarter comp estimates.
“Unexpected” bad results followed by the “low oil prices/great jobs” expectation that has become standard. That continued in March, with “port strike” talk taking over where weather receded.
Despite facing easier comparisons from a year ago, 67% of the retailers tracked by the Thomson Reuters Same Store Sales (SSS) Index missed their SSS estimates in February and blamed adverse weather. The SSS index’s actual result for February registered a sluggish gain of 0.6%, missing its final estimate of 1.5%. Excluding drug stores, the index recorded a 1.2% comp, missing its 2.1% final estimate.
By May (figures for April), nothing was going right and the unquestionable forecasts that started out the year were starting to seriously waver; same excuses, mostly, but now a slightly downgraded interpretation of their continuation. That included base effects that abruptly and for some unexplained reason provide some reset of consumer temperance:
Last year’s spring surge in retail sales affected this year’s results with a thump, as many store chains were not able to match their year-ago numbers. The Thomson Reuters Same Store Sales Index actual result for April 2015 registered a -0.6% decline, missing its -0.4% final estimate. Excluding the drug store sector, the index fared even worse: a -1.5% result for April, missing its -1.1% final estimate.
It’s also the first negative result for 2015. The last time the index saw a decline was in August 2009 at -2.3%…
The latest economic indicators, including the Thomson Reuters/Ipsos Primary Consumer Sentiment Index (PCSI) suggests that consumers might be feeling cautious about the U.S. economy. What’s more, when incorporating the quarterly reporting retailers, it’s evident by the earnings/SSS results that consumers are shifting their spending behavior. They seem to be sticking to necessities and purchasing items they believe add value. [emphasis added]
That last part contrasts greatly with the ideas expressed about what were really mediocre holiday figures. It seems almost assured now that it has been the Establishment Survey alone that provided such great optimism, but increasingly even retail “analysts” and their commentary is no longer so greatly enthralled by its purported magical properties. Whereas Janet Yellen on Friday signaled that her expectations of what the jobs market was supposed to be might be no longer, retailers are getting the same ideas if not quite yet ready to fully acknowledge what that might mean.
This was also from last week, in discussion of then-upcoming June same store results:
Compared to last year, U.S. retail same store sales (SSS) growth in June 2015 is expected to be sluggish. The supply chain is still working out the effects of February’s labor action at West Coast ports.
Overall, the Thomson Reuters Same Store Sales Index forecast for June 2015 is a gain of 0.7%. Excluding the drugstore sector, the SSS growth rate drops to 0.3%. Both are below the 4.0% result – in each category — recorded in June 2014. The 2015 outlook is also below the 3.0% growth rate considered healthy for consumer sales.
Labor talks between the International Longshore and Warehouse Union and the Pacific Maritime Association were resolved in February, but disruptions at West Coast ports was still cited as a factor in the 0.2 percent annual rate contraction of the U.S. economy in the first quarter of the year.
The port strike ended in February but the disruption “was still cited as a factor in the 0.2 percent annual rate contraction” only because economists and businesses that have relied on their assumed expertise are still in denial. To admit that the port strike had no bearing on June retail activity would mean countenance of a dark side potential to the economy that was thought only months ago as “impossible.” A few days after that, on Friday, June’s results were posted, and they were almost as ugly as April (so much for that bounce):
Looking at the retail sales picture for June, it seems that people enjoyed the start of summer without going to the malls. Excluding drug stores, the Thomson Reuters Same Store Sales (SSS) Index registered a -0.4% comp for June, missing its 0.3% final estimate. Including the Drug Store sector, SSS improves to 0.2%, but missed its final estimate of 0.7%. Results were mixed as 56% of retailers beat estimates.
Retailers in the SSS index generally posted disappointing results for June, as the expected boost to consumer purchasing power from lower gas prices failed to materialize. The lingering effects of the labor disruption at West Coast ports earlier in the year was [SIC] also cited.
There is no way that any analysts or economists in January would have thought it possible that June, and all the sunshine and labor-driven gains, would be written, economically, as “people enjoyed the start of summer without going to the malls.” Unfortunately, they didn’t go to any other retail outlets, either. The consumer disappeared in June (which should make the June retail sales report quite interesting) contrary to all expectations. However, unlike all prior pieces on the retail sector, Thomson Reuters in that latest is conspicuously missing the typical words of encouragement, the ever-present reference to the great and good, perhaps epic, labor gains of the past year and a half or so (and the attendant expectations for that to continue).
This may be a subtle economic downgrade in narrative, but it is as significant as the ugly, atrocious numbers that accompany it. Where the year started with no downside acceptable, it is now at least unspoken as potential without the ubiquitous Establishment Survey offset that has been the bedrock economic association since QE was first threatened with taper. Economists will not be able to figure out why, including those at the CBO running nothing but ARCH, GARCH and the rest, but, ironically, it is the CBO’s own figures that provide at least the contours of the great structural problem leading fully toward a potentially-disastrous cyclical add-on.
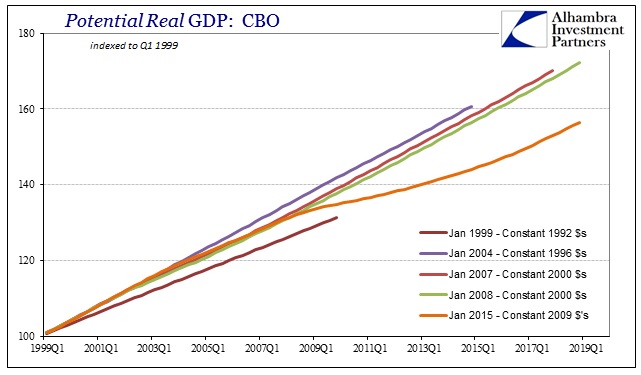
Included with all these economic assessments and forecasts, the CBO also models economic “potential.” They do so on basic Phillips Curve-type assumptions which are, frankly, wrong, but that isn’t the issue here. You can tell a great deal about what is taking place by what is missing, even in calculations that are based on highly flawed economic assumptions and recency bias.
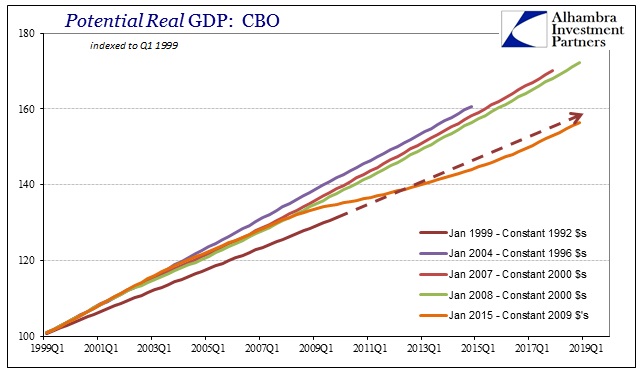
In the chart above I have plotted the historical predictions at certain intervals of the CBO’s calculations for GDP “potential” going back to 1999. In subsequent updates from that 1999 start, the economy appears as if it significantly outperformed for the whole of the dot-com cycle and housing bubble (remember, potential is not actual GDP; actual GDP in 2008 and 2009 came in less than the 1999 forecast for potential by more than a little). The January 2004 forecast for the economy’s potential was the most robust, no doubt owing to how GDP and economic/financial forces were being viewed at that moment (including Greenspan’s “conundrum”).
By January 2007, however, there was a rather significant downgrade which was followed by another slight repeat in the CBO’s January 2008 figures – some belated recognition, surely, of the then-gaining housing bust. Of course, now in 2015 without any recovery to speak of, the models have been “forced” to unwrite all that massive bubble potential. Viewed, however, in context of that first 1999 forecast, what the CBO has done (without, again, recognizing or at least acknowledging) is to essentially remove the prior asset bubble foundations from the economy’s still-future potential – bringing the economy (or, at least this view of it) back to its pre-bubble assumptions.
Taken another way, which I would view as proper, this says without much ambiguity that even the orthodox models now view the prior asset bubbles as the “anomalies” which hold no permanent increase in economic potential (instead, it could be argued as a corollary that they do the opposite and render actual long-term harm). This is a total violation of monetary neutrality and even rational expectations, among other orthodox theories, as economic potential is supposed to be a one-way affair. Recessions, even those that might be great, are not supposed to affect long-term performance in the negative let alone deeply and long-term negative, but the total economic disaster since 2006, really, has forced even orthodox modeled projections to “find” that interpretation by essentially default. This is far more than orthodox economics in need of fine-tuning, showing on its own terms that it gets almost nothing right about how an economy works, “aggregate demand” assumptions and especially what to do about marginal changes (“stimulus” policies).
The attempts to act, in terms of both fiscal “automatic stabilizers” and monetary policy, as if 2006 represented actual potential ends up being instead, inarguably, totally ineffective if not, arguably, quite harmful. I would argue that the looming and now-persistent cyclical problems in 2015 relate specifically to this disparity, especially the QE’s and their assumed economic basis, which has fostered a largely hidden or “intangible”, ongoing, attrition.
In other words, there was no basis for the Establishment Survey other than trend-cycle estimates of what might be coming rather than what even orthodox models were suggesting about economic function already having occurred or occuring. Without that origin the future becomes rather dreary to the point of even gravity on economics alone, but especially on remaining and unsolved imbalances of a great many factors like consumerism and even the federal deficit. In short, we are starting to see the fuller extent of the economy without recovery as it heads closer to another recession absent a prior cycle upturn (a supercycle) – an unprecedented occurrence that is now quite and dangerously far from impossible.

