The other day I showed you data on Federal Withholding Tax collections that suggested that the US economy is beginning to overheat. Data on other tax collections in June from the US Daily Treasury Statement also is leaning that way. It takes a month or two for the economic data to catch up with the reality of what is happening in real time.
The tax collections data has no lag. It tells us what is going on in real time, with no manipulation whatsoever. We merely need to track it to know what’s coming in the lagging economic data reports. That gives us an edge enabling us to stay ahead of the crowd to take advantage of, or protect ourselves from, what’s coming.
In this case, strong economic data will encourage the Fed to begin its promised course of balance sheet reductions. That will be a real tightening, as opposed to the sham tightening of increasing the interest the Fed pays the bank on the excess reserves at the Fed.
Jim Rickards refers to this coming balance sheet reduction as Quantitative Tightening. I think that’s an apt monicker. Just as Quantitative Easing, QE, or money printing, pumped money into the markets and drove the asset bubbles that are still raging today (see yesterday’s price data on new home sales), QT will drain money from the markets and starve those bubbles.
The Fed will start small at $10 billion a month in reductions, and the effects will be small. But the plan is to increase the size of the reductions over one year to a more draconian level of $50 billion per month. The strong economic data that’s coming will only encourage the Fed to start faster and maybe even tap the brakes harder.
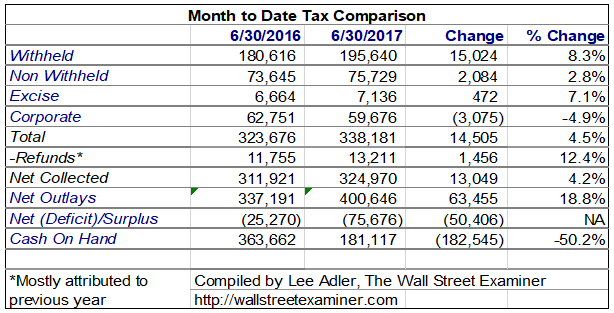
The moving average method of measuring real time withholding tax collections told us that collections rose 6% on a year to year nominal basis. That’s hot, but it’s also smoothed and lagged. Collections were weak early in the month, then accelerated in the last two thirds of the month. Looking at the actual monthly statement data, the gain was an incredible 8.3% year over year. That more clearly represents the huge pop in the second half of the month.
The rest of the data was nearly as eye popping.

Note that the BLS’s data on nonfarm payrolls is collected early in the month with an “as of” date as the 12th calendar day of the month. That was approximately where the trough of the usual oscillation in collections is. Other economic data is based on end of month numbers. Those series are likely to be stronger than the jobs numbers. I reiterate that strength at this late stage of an economic expansion is bearish because it will encourage the Fed to pull the punchbowl.
Individual Income Taxes on Small Business Sole Proprietors and Gig Workers (Non-withheld)
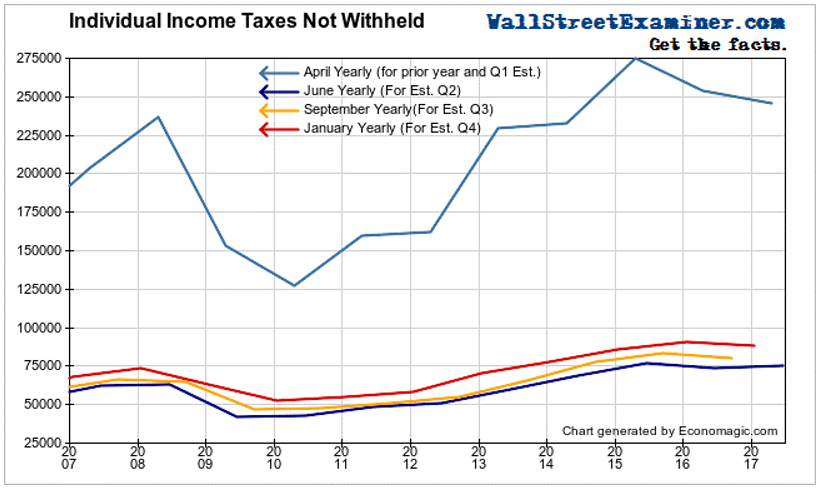
Individual quarterly estimated taxes are due in June. The Daily Treasury Statement for June showed a gain of 2.8% year over year. That doesn’t sound like much, but it’s better than it has been. The 5 previous quarterly tax due months had declines. Small businesses and gig workers had a so-so second quarter, probably rescued by the strength in June. It meant that they were a little more profitable in the quarter, interrupting the weakening trend of the past 2 years. But isn’t a clear sign that the trend has reversed.

Corporate Taxes
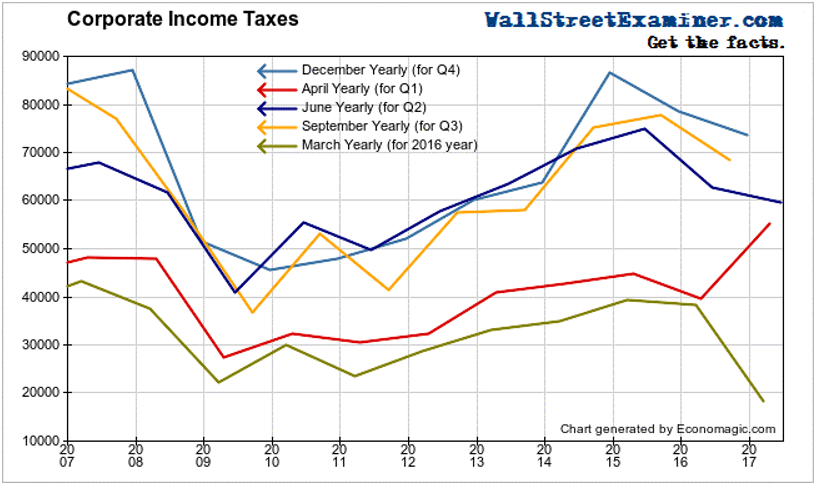
Quarterly corporate income taxes are also due in June. These are estimated taxes for the second quarter. They declined by 4.9% year to year after a strong first quarter. Corporate taxes had been declining since 2015, reflecting falling profits from shrinking business revenue. That was interrupted by a strong gain in the first quarter. This decline is a return to the form of the past couple of years. It again signals that stocks are rising on liquidity driven multiple expansion, not on business fundamentals.

Excise taxes
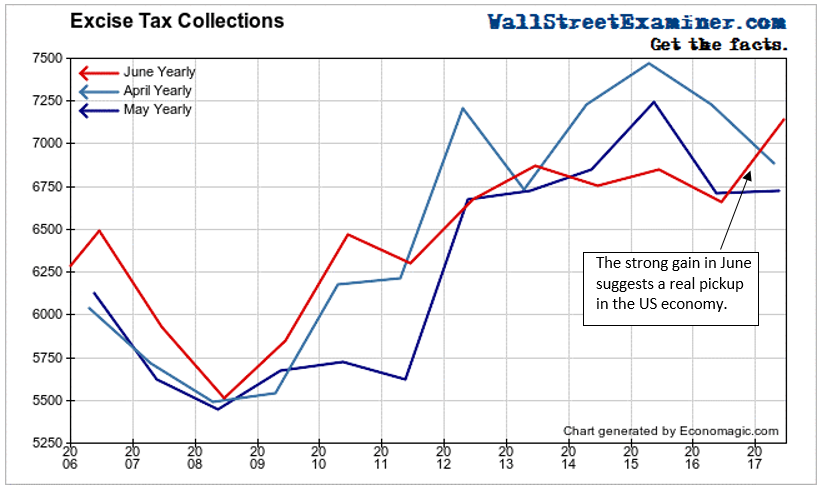
Excise taxes collections were very strong in June, reversing a yearlong series of declines. Excise taxes are collected on a cross section of goods which represent a good sampling of economic activity. They are based on unit volume, not price and are therefore an excellent measure of real final sales volume, with no adjustment needed for the impact of inflation. They are collected from large payers twice a month with a half month lag.
Excise taxes in June rose by 7.1% year to year. The gain in June was the first real sign of a pickup in the economy. May was up 0.2%. April was down 4.8%. March was up sharply but that appeared to be a result of a big underpayment in February. Taken together, February-March were flat from 2016.

A technician would see the red line representing June as a breakout from a long-term consolidation. This suggests that the US economy is suddenly accelerating and may even be overheating. We could see very strong numbers for June retail sales, and in measures of industrial production and manufacturing orders. That would give the Fed reason to tighten even more aggressively than the consensus expectation.
Such economic strength would come as a surprise to the market and would be likely to spook traders. It would be a quintessential sell the news moment and it could lead to a big selloff. Better to sell now, or at least before these news releases, and beat the rush.


