
This was a data set we didn’t need. Not one bit. It mauled our hopes. But the US Census Bureau dished it up anyway: wholesales declined again, inventories rose again, and the inventory-to-sales ratio reached Lehman-moment levels.
In August, wholesales dropped to $445.4 billion, seasonally adjusted. Down 1.0% from July and down 4.7% from August last year.
It was ugly all around. Wholesales of durable goods dropped 1.2% for the month, and 1.9% year over year. The standouts: Computer and computer peripheral equipment and software plunged 5.1% for the month and 6.2% year-over-year. Machinery sales dropped 2.7% from July and 3.5% year-over-year. Both are the signature of our ongoing phenomenal white-hot high-tech investment boom in corporate America, focused more on financial engineering than actual engineering.
Wholesales of non-durable goods fell 0.7% for the month and plunged 7.2% year-over year! Standouts: petroleum products (-36.6% year-over-year) and farm products (-12.4% year-over-year). They’ve gotten hammered by the commodities rout.
But the pharmaceutical industry is where resourcefulness shines. At $52 billion in wholesales, drugs are the largest category, durable or non-durable. And sales rose another 0.9% for the month and jumped 14% from a year ago! Price increases in an often monopolistic market can perform stunning miracles. Without them, wholesales would have looked a lot worse!
Falling sales are bad enough. But ominously, inventories continued to rise from already high levels to $583.8 billion and are now 4.1% higher than a year ago.
Durable goods inventories rose 0.3% for the month and 4.2% year-over-year, with automotive inventories jumping 13.5% year-over-year. Non-durable goods inventories are now 4.0% higher than a year ago, with drugs (+5.4%), apparel (+11.6%), and chemicals (+7.9%) leading the way. But petroleum products inventories dropped 21.9% year-over-year.
The crucial inventory-to-sales ratio, which shows how long merchandise gets hung up before it is finally sold, has been getting worse and worse. In July last year, it was 1.17. It hit 1.22 in December. Then it spiked. In August, it rose to 1.31, the level it had reached just after the Lehman moment in 2008:
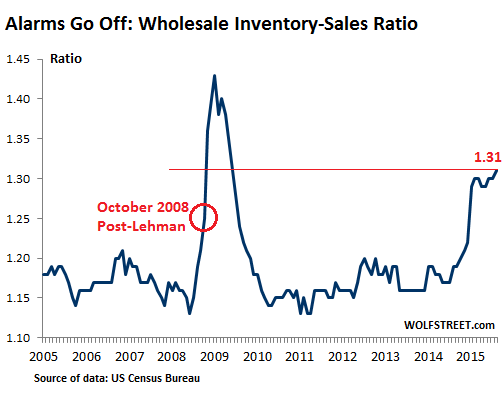
Inventories tie up cash. So inventory management is a data-driven obsession. Companies that are optimistic about sales prospects stock up. But when sales fall instead and hopes hit reality, inventories balloon and the inventories-sales ratio rises. And now it has risen to ugly levels.
So does today’s low cost of capital obviate tight inventory management?
Hardly. Even today, for most companies, capital isn’t free. And there are millions of other reasons why large inventories are a risk: spoilage, changing fashions or customer preferences, new products and obsolescence, stuffed warehouses and overflowing storage tanks…. When inventories get out of hand, they become a nightmare, and whittling them down often means big price cuts and write-offs, euphemistically called “inventory adjustments.” Cash down the drain.
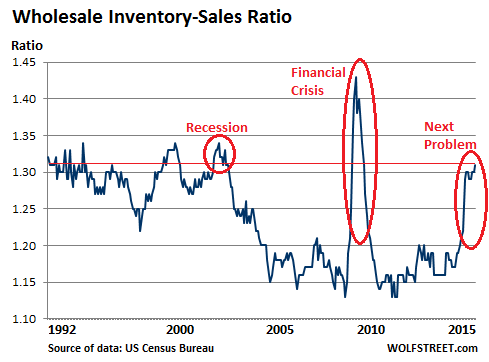
The ratio had been much higher back in the day. But computerized inventory management and ordering systems that replaced index-card systems allowed businesses to reduce their stocks while improving sales. The wholesale inventories-sales ratio declined over the decades. It reached 1.14 in October 2005. After the turmoil of the Financial Crisis, the ratio dropped to 1.13 in early 2011.
But the trend has once again reversed. And the last two times the inventory-sales ratio reached this level, all heck was breaking lose:
Wholesale merchants, hit by declining sales, aren’t seeing that rosy scenario. Instead, they’re now stuck with big-fat inventories. That increase in inventories added to GDP. But when these merchants are trying to get their inventories back in line, they slash orders. That’s when they push their inventory debacle up the supply chain: these orders are revenues for their suppliers.
This can get ugly in a hurry, ranging from a business cycle recession, as in 2001, to a panic, as seen in October 2008, when the supply chain began to freeze over. During both periods, stocks crashed. And now stocks are perched at ludicrously high levels, teetering, waiting for just such an event.
With sharply dropping revenues and overcapacity that looks to be “even greater than in 2009,” the shipping industry and the lenders and bondholders that fund it are facing a tough future. Read… Global Shipping Veers into Capital Destruction

