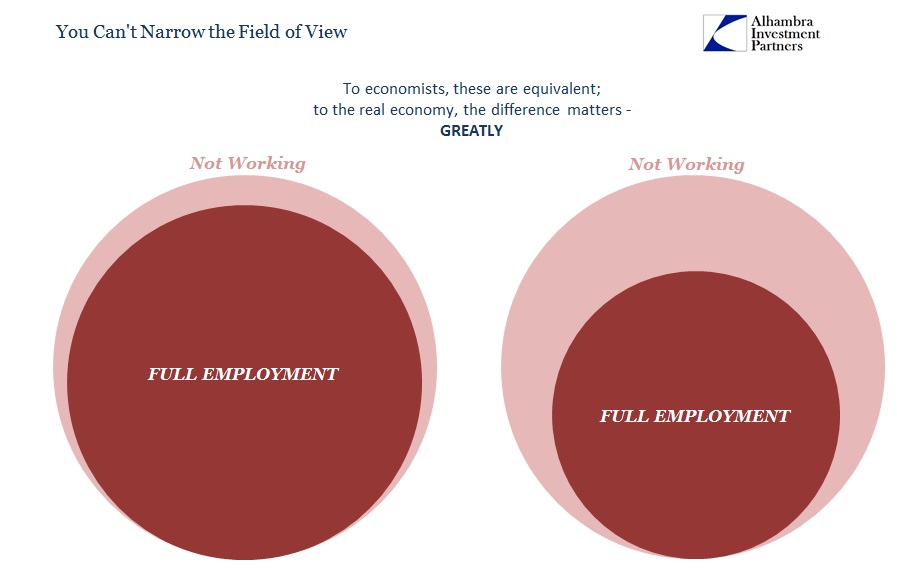
When the unemployment rate tumbled toward 5% and now below it, economists thought that was overheating. For monetary policy, that was much of the basis for adjusting Fed communication (not rate hikes, as credit and funding markets are doing the opposite). Despite the “best jobs market in decades”, however, confirmation of that robust labor agenda is scarce at best and really non-existent.
For instance, the last time the unemployment rate was at or near “full employment” below 5% was 2007 just prior to the Great Recession. That year there were an average of 26.3 million Americans receiving Supplemental Nutrition benefits, or SNAP. As of the latest estimates from the USDA for November 2015, there were 45.5 million under SNAP assistance even though again a 5% unemployment rate and orthodox suggestions of “full employment”. The difference of 19 million matches the general outline of the “missing” 15 million from the employment statistics, and thus the overall economy.
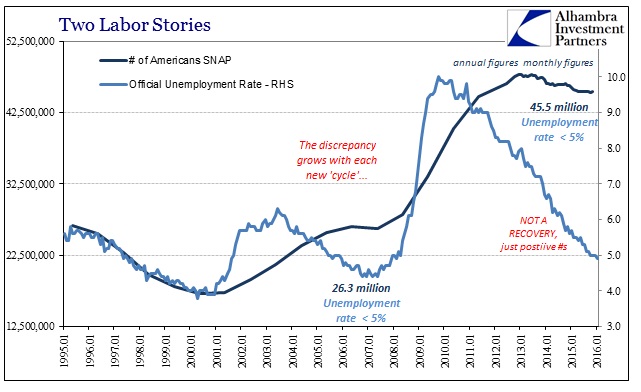
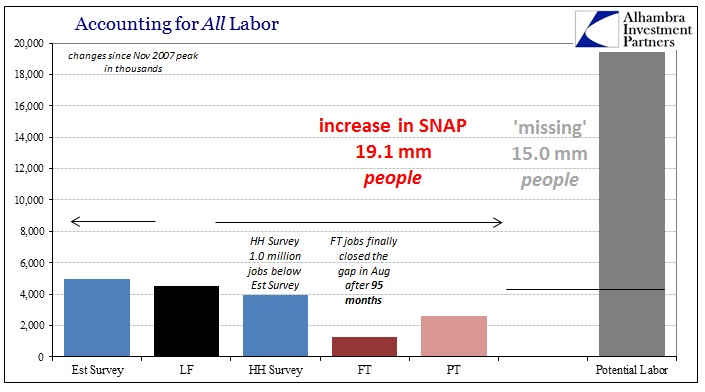
As you can see in the first chart above, the discrepancy did not start with this “cycle” but actually the one before it – the “recovery” after the dot-com recession featured the same seeming permanence. The level of apparent subsistence has only grown despite the assurances of the unemployment rate in each cycle, exploding especially in the aftermath of the Great Recession. It suggests, as the participation rate, that the labor statistics are only detecting an increasingly withered corner of the overall economy. In other words, the whole economy shrinks but the mainstream statistics only detect pieces that suggest it didn’t. Further, the whole economy has been under this shroud since the turn of the century – just as the serial asset bubbles got fully underway.
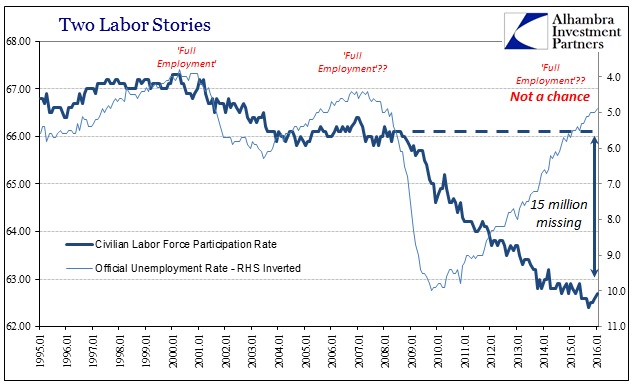
That SNAP levels and the participation rate would so closely align and therefore conspire directly against the mainstream version of the economy is highly compelling; especially since both the unemployment rate and Establishment Survey are so highly managed and adjusted. They are, in general, intentionally narrowed views that by 2016 are dedicated to far too small an economic proportion to be useful. The SNAP/participation rate picture of the economy matches increasingly the dearth of spending and income/wages. It never made sense that a “manufacturing recession” would develop during the “best jobs market in decades”; those are not just different economic suggestions, they are so different as to be mutually exclusive.
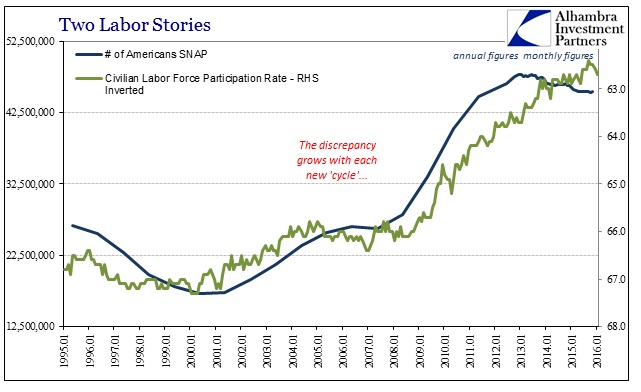
Being “payroll week” with the latest stochastic process of employment variability set to be released, this gigantic discrepancy should be kept in mind as the largest grain of salt in the history of economic data. That includes the trajectory in SNAP utilization which over the middle months last year showed no improvement at all where the economy really turned sour.
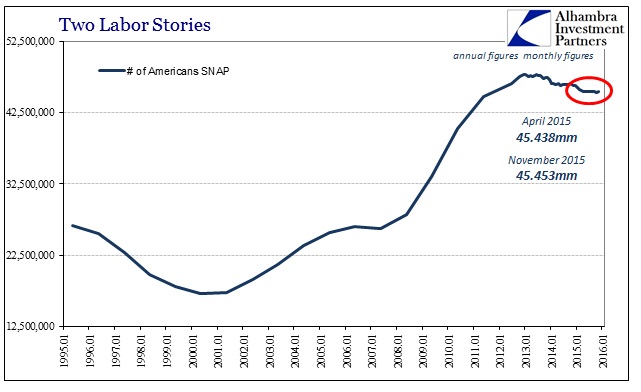
In one final piece of relevant data, incomes reported by SNAP recipients continue to decline for those that are actually working.
The uneven recovery has swelled the ranks of long-term unemployed and reduced the number of people working or looking for work, further boosting demand. Even for those with jobs, pay may be lower than in the past: In real dollars, SNAP recipients in 2014 had net incomes of $335 a month, the lowest since at least 1989.
That suggests mainstream economic accounts are like statistical averages being skewed by the higher end; in this circumstance, the bifurcated economy is perilously so and the major statistics supposed to project a solid estimate for the whole economy are increasingly limited to just the parts that are working (pun intended) missing the worsening deterioration elsewhere. The “manufacturing recession”, therefore, suggests again attrition is more powerful than redistribution, exactly like what is more obvious in Japan. In other words, the deficient and decaying part of the economy is dragging down the whole, but the mainstream will only take the limited view of the major accounts and wonder where this weakness is coming from.
