
“
Wishful Thinking
The confusion at the Fed continues as Federal Reserve Bank of San Francisco President John Williams painted an upbeat picture of the U.S. economy in a speech on Tuesday. This, of course, comes despite recent disappointing data on both the employment and economic fronts.
“The economy is in good shape and headed in the right direction. As a result, it makes sense to get back to a pace of gradual rate increases, preferably sooner rather than later.”
Of course, the Fed’s Williams is once again “jawboning” the media and Wall Street, as despite their best efforts over the last several years, economic growth has continued to slow to ever lower growth rates. This is clearly shown in the chart below which shows the Fed’s “predictions” versus actual outcomes.

However, despite Mr. Williams hopes of stronger economic growth in the months ahead, the data currently doesn’t suggest this will be the case. Let’s start with the manufacturing and service data.
In June, I discussed my Economic Output Composite Index (EOCI) which is a very broad measure of economic activity consisting of not just manufacturing data, but services as well as leading indicators. (The chart below compares the EOCI to both GDP and the Leading Economic Indicator Index. The EOCI is comprised of the CFNAI, Chicago PMI, LEI, NFIB, ISM, and Fed regional surveys.)
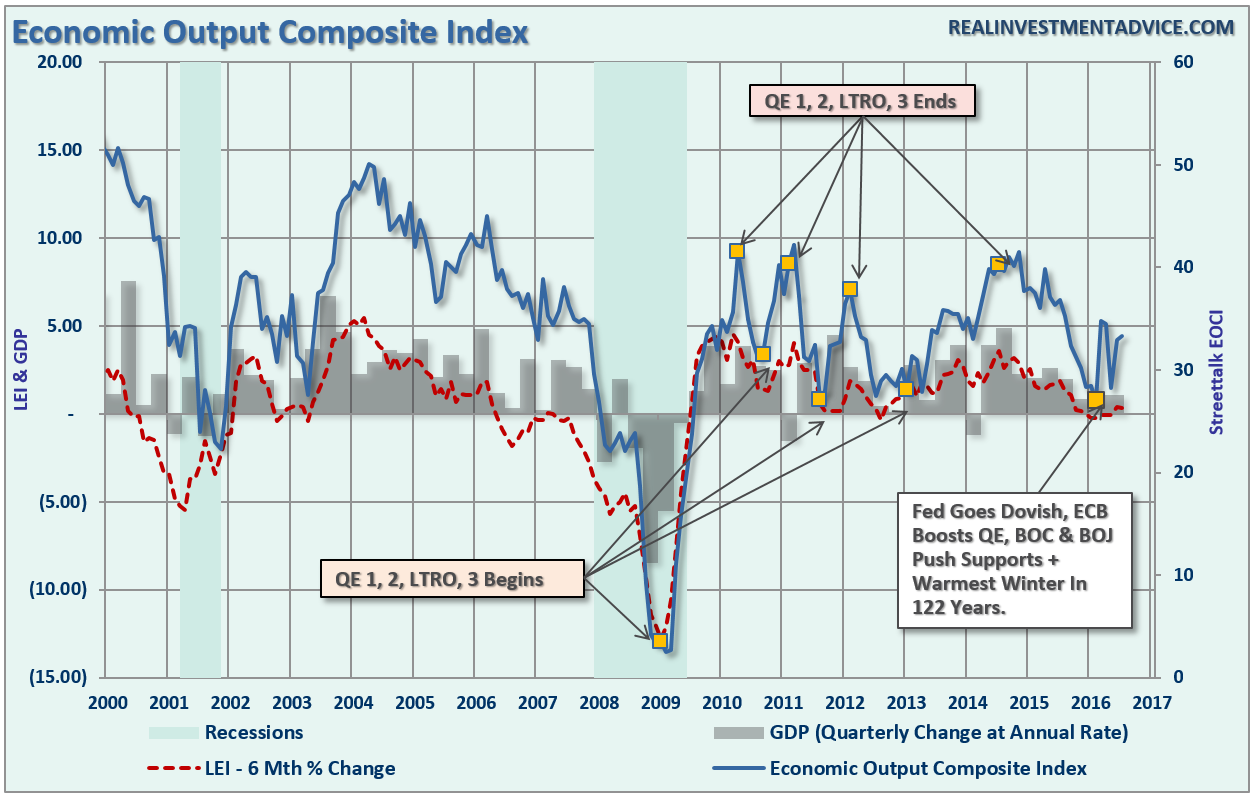
As I have explained previously, since 2009 the U.S. economy has remain mired in an ongoing rotation between inventory draw downs which lead to restocking cycles. These restocking cycles provided a temporary boost to economic activity but very quickly that activity fades and the economy softens once again.
This time has been little different. The recent restocking cycle once again came lined with hopes of continuing economic strength, however, much of the data now coming in suggests those hopes may once again be disappointed.
The recent releases of the ISM Manufacturing and Services index suggest this to be the case. With both of the indices slowing sharply in the past month, the subsequent data releases of manufacturing and service data are likely to slow also. The chart below is a composite index (and one of the components of the EOCI) which is an average of both ISM indexes.

As illustrated, it is not uncommon during an economic cycle for the composite ISM to have a growth stage followed by a slow down, a secondary growth bounce which leads to the next recession. We see much of the same pattern developing currently which suggests that we are late in the current economic expansion. With the composite index sitting currently at 50.4, the risk of slower economic growth through the end of the year has risen markedly as the trend of the data over the last several months is negative.
But dont’ take my word for it. Here is Chris Williamson, Chief Economist at Markit:
“The weak PMI readings send a downbeat note on economic growth in the third quarter. Taken together, the manufacturing and services PMIs are pointing to an annualized GDP growth rate of a mere 1%, similar to the subdued pace signaled by the surveys throughout the year to date, suggesting that those looking for a strengthening in the rate of economic growth will be disappointed once again.”
Fed’s Got An Employment Problem
Speaking of disappointing. Despite mainstream trumpeting of the recent employment data headlines, Danielle Dimartino-Booth recently put it into perspective. (Admit it, you gotta love a woman who quotes “Dirty Harry.”)
“I know what you’re thinking: ‘Did he fire six shots or only five?’ Well, to tell you the truth, in all this excitement, I’ve lost track myself. But being this is a .44 Magnum, the most powerful handgun in the world, and would blow your head clean off, you’ve got to ask yourself one question: ‘Do I feel lucky?’ Well, do you punk?
Investors no doubt went into the recent August jobs report asking themselves the same question, whether they too felt lucky. It’s a good question, all things considered.
The Bank Credit Analyst reckons that valuations on the stock market are near record levels as gauged by the median price-to-earnings ratio. And evidence is mounting that retail investors are flocking into stocks after a prolonged buyers strike. Vanguard, the crowned king of passive investing, raked in a record $25 billion in August alone, taking the total thus far this year to nearly $200 billion. The groundwork is laid to surpass 2015’s record $236 billion in inflows.
In the minds of the slaves to momentum, the only thing standing in the way of fresh record highs in the stock market is a measly quarter-of-a-percent rate hike care of the Federal Reserve. And the only thing that assures that rate hike comes to pass is a jobs market that’s also gaining momentum.
That message was certainly not in the August data released this morning. Forget the abysmal pace of job creation in May – that paltry 24,000 figure was an aberration. By the same token, discount the strength in June and July, where average gains of 273,000 also look deceptively high. Focus instead on the 12-month average of 204,000. That’s the best yardstick against which to compare August’s 151,000-gain, which fell short of consensus estimates of a 180,000 gain.
So nothing disastrous, and nothing remarkable. The outcome, just what the market most wished for, was simply too wishy-washy to pull the Fed off the sidelines. We now reset the clocks and ask ourselves if we’re feeling any luckier about September job growth.”
So, with investors chasing stocks on the assumption the economy is improving, and the Federal Reserve expecting to normalize rates into a stronger economic environment, the simple question is whether they will be right? The problem is the Fed’s own data suggests they won’t.
In May of 2014, the Federal Reserve began discussing a newly designed labor market index to help support their claim that employment conditions in the U.S were improving. This was an important facility for the Fed which needed support to raise interest rates. My good friend Doug Short has a complete discussion on the LMCI, which is worth reading for context. As he defines:
“The Labor Market Conditions Index (LMCI) is a relatively recent indicator developed by Federal Reserve economists to assess changes in the labor market conditions. It is a dynamic factor model of labor market indicators, essentially a diffusion index subject to extensive revisions based on nineteen underlying indicators in nine broad categories.
The indicator, designed to illustrate expansion and contraction of labor market conditions, was initially announced in May 2014, but the data series was constructed back to August 1976.”
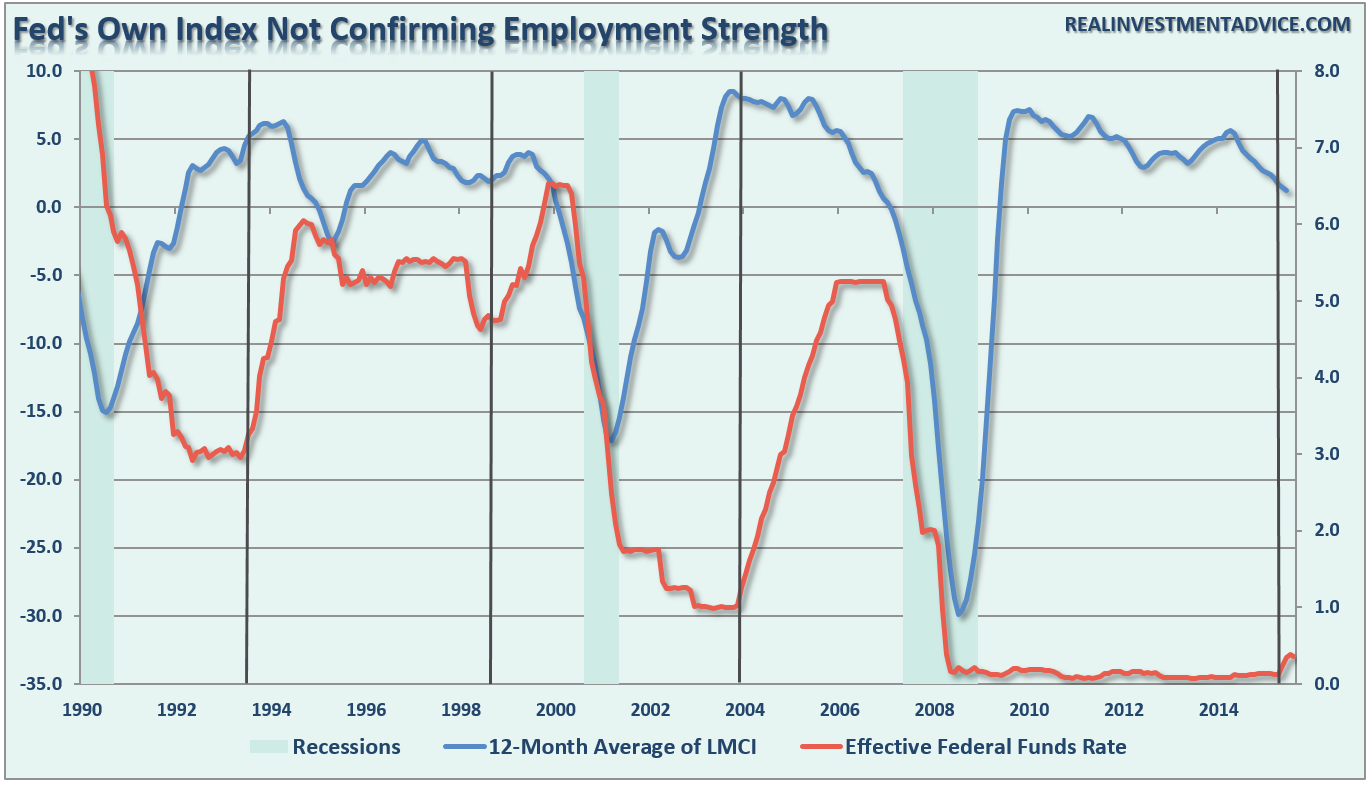
As stated, the Fed’s own index is not supporting the Fed’s claims that employment is growing at a rate strong enough to withstand a tightening of monetary policy. In fact, as shown in the chart below, the LMCI index (smoothed with a 12-month average) has been a leading indicator of future weakness in employment. The recent downturn in the LMCI suggests that employment gains may more muted in the months ahead.

Therein lies the problem for the Fed. If the LMCI is indeed forecasting weaker employment, then the Fed’s ability to raise interest rates is negated. However, as shown in the chart below, the Fed has ALWAYS been late to the game when hiking interest rates. Each time the Fed began hiking interest rates was at the point the LMCI had effectively peaked.
Once again, the Fed is behind the curve in tightening monetary policy. With employment likely to weaken further in the months ahead, along with the economic, the ability to lift rates in the current environment is extremely risky. In other words, in an economy growing at roughly 1% currently, there is very little room to avoid a policy mistake.
As Larry Summer just recently stated:
“My second reason for disappointment in Jackson Hole was that Federal Reserve Board Chair Janet L. Yellen, while very thoughtful and analytic, was too complacent to conclude that ‘even if average interest rates remain lower than in the past, I believe that monetary policy will, under most conditions, be able to respond effectively.’ This statement may rank with former Fed chairman Ben Bernanke’s unfortunate observation that subprime problems would be easily contained.”
Retail-Less
While the weakness in the LMCI is suggesting more disappointing employment growth ahead, retail sales are suggesting that the economy is likely much weaker than headlines suggest.
The chart below shows the annual percent change in retail sales on a monthly basis with a 3-month moving average to smooth the volatility. This gives a much more realistic look at what is actually happening with retail sales in the economy that makes up roughly 40% of total personal consumption expenditures.
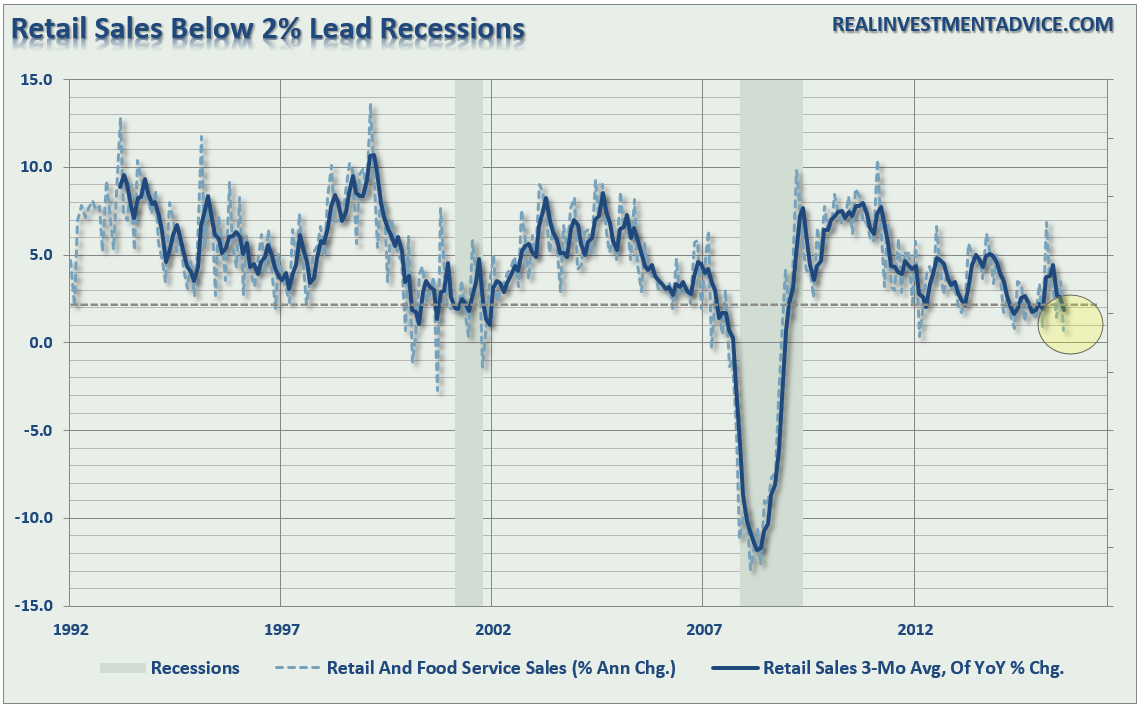
As shown, when retail sales have fallen below 2% growth it has historically been a leading indication of the onset of economic weakness or a recession. While there has been no official recession call as of yet by the NBER, it is important to remember that much of the economic data is subject to rather large annual revisions. It will not be surprising to see economic growth revised lower next year.
The chart below shows the annual rate of change in “control purchases” which is more closely related to the actual activity of average consumers. I have overlaid the analysis with a simplistic economic cycle. Again, as shown above, control purchases are also suggesting that the economic environment is, in fact, very weak.

The weakness in retail sales will feed into the personal consumption component of GDP which comprises almost 70% of the economic equation. Combined with the economic and employment data, this will likely continue to be a problem for the Fed.
Just some things I am thinking about.

